FIG. 2.

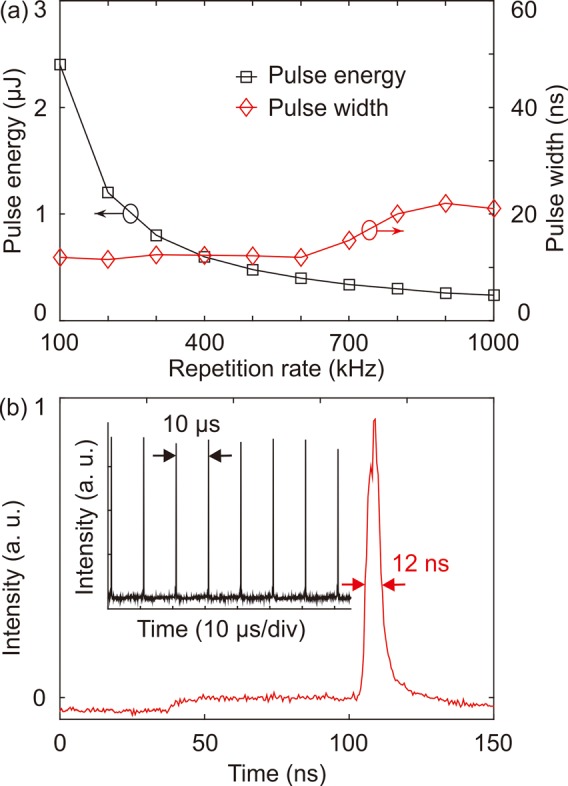
(a) The measured pulse energy (black square) and pulse width (red diamond) of the output pulse as function of the PRR. (b) The temporal trace of the output pulse at 100 kHz: the inserted figure is the pulse train.

(a) The measured pulse energy (black square) and pulse width (red diamond) of the output pulse as function of the PRR. (b) The temporal trace of the output pulse at 100 kHz: the inserted figure is the pulse train.