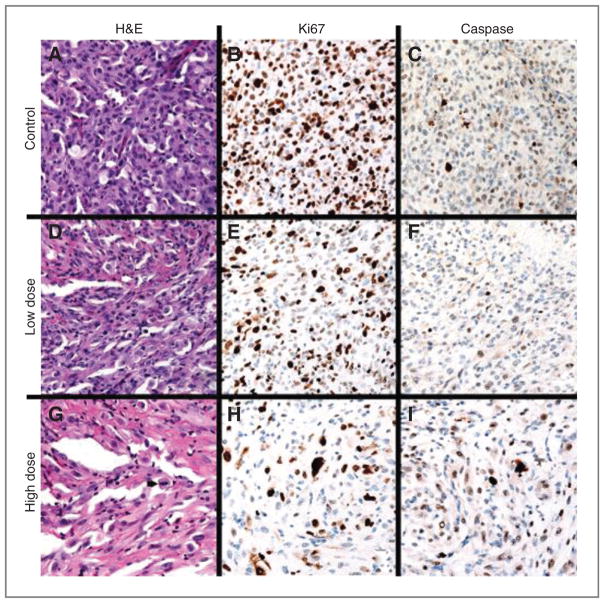
Figure 3.
A–C, (top row, left to right) Control animal 1, H&E 400× (A) with 3 mitotic figures (white arrowheads) in a single HPF; Ki-67 400× (B) labeling approximately 80% of tumor cell nuclei; caspase 400× (C) labeling a subset of tumor cell nuclei. D–F, (second row, left to right) low-dose animal 3, H&E 400× (D) with one mitotic figure (white arrowhead) in a single HPF; Ki-67 400× (E) labeling approximately 50% of tumor cell nuclei; caspase 400× (F) labels rare tumor cell nuclei. G–I, (third row, left to right) high-dose animal 2, H&E 400× (G) with one mitotic figure (black arrowhead) in a single HPF; Ki-67 400× (H) labeling approximately 20% of tumor cell nuclei; caspase 400× (I) labeling a subset of tumor cell nuclei.

