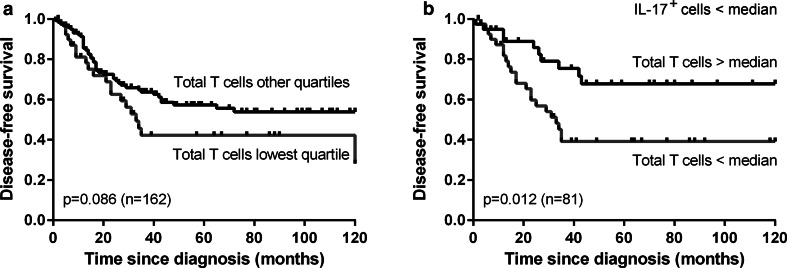
Fig. 3.
Kaplan–Meier disease-free survival curves for a low (i.e., lowest quartile) versus higher number of total T cells among all patients (a) and a low (i.e., below median) versus high number of total T cells among the patients with a below median number of IL-17+ cells/mm2 (b) in the tumor epithelium and stroma combined

