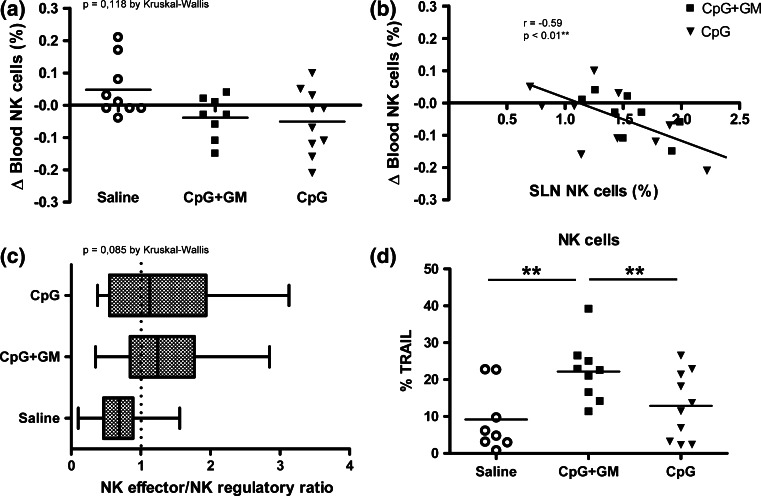
Fig. 2.
CpG/GM effects on NK cells. a Absolute changes in percentages of blood NK cells between t = −7 (pre-treatment) and t = 0 (post-treatment) are shown. b Changes in peripheral blood NK cell frequencies for CpG ± GM-administered patients are significantly and reversely correlated to corresponding SLN NK cell frequencies. c Shift from predominant regulatory CD56bright to more effector CD56dim NK cells in the melanoma SLN. Average CD56dim/CD56bright ratios are shown for each group by box and whisker plot. d Surface TRAIL expression on SLN NK cells. *p < 0.05; **p < 0.01

