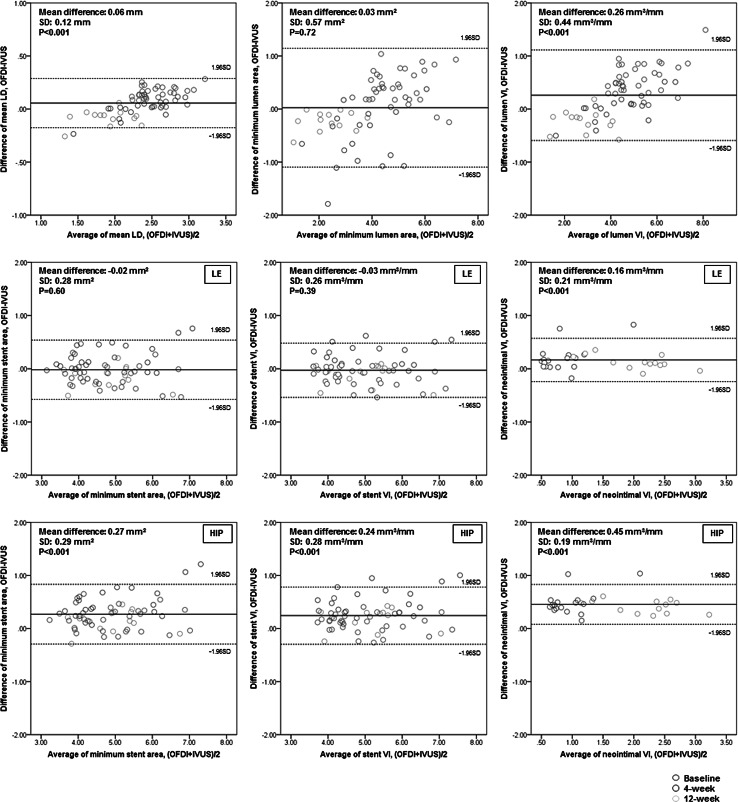
Fig. 4.
Bland–Altman analysis for OFDI/IVUS parameters (in vivo study). In each panel, x-axis represents the average of measurement between OFDI and IVUS, and y-axis represents the difference of measurement between OFDI and IVUS (measurement by OFDI—measurement by IVUS). Solid line shows mean value of LD difference in each modality, and two dotted lines show ± 1.96SD of difference between two modalities. IVUS intravascular ultrasound, LD lumen diameter, OFDI optical frequency domain imaging, SD standard deviation, VI volume index. HIP and LE indicate the stent trace in OFDI image was performed either at highest intensity points or at leading edges

