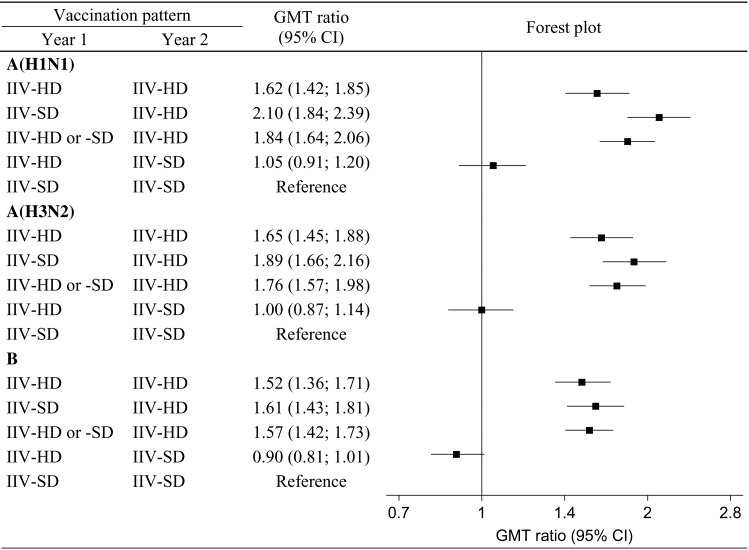
Figure 2.
Geometric mean titer (GMT) ratios and forest plot. GMT ratios presented are for each vaccination pattern relative to the year 1 (Y1) standard-dose inactivated influenza vaccine (IIV-SD), year 2 (Y2) IIV-SD vaccination pattern. Vaccination patterns are based on vaccine assigned at randomization in Y2, and vaccine actually received in Y1. Samples for assaying were collected approximately 28 days after Y2 vaccination. The plot on the right depicts GMT ratios for each vaccination pattern; horizontal lines represent the 95% confidence intervals (CIs), and solid squares represent the point estimates. All estimates to the right of the null value of 1 favor the corresponding pattern over the referent. CIs that do not intersect with the null value are statistically significant. Abbreviation: IIV-HD, high-dose inactivated influenza vaccine.

