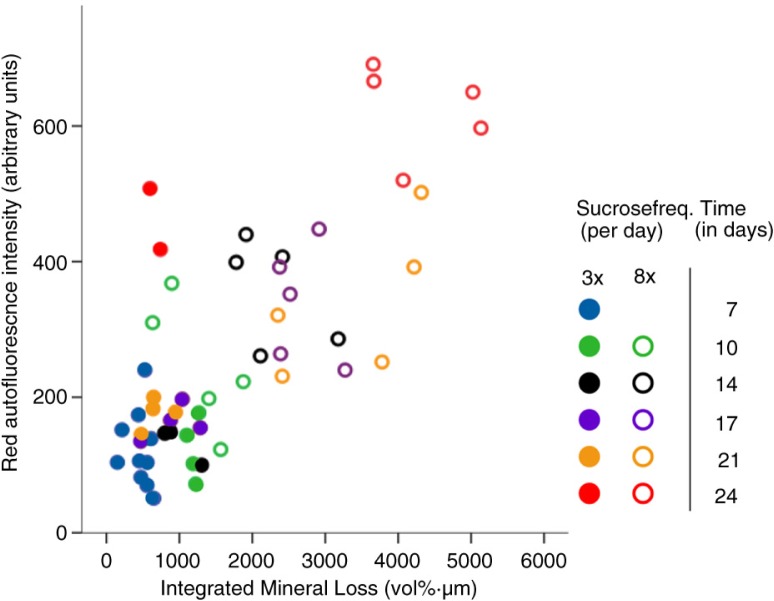
Fig. 3.
The effect of sucrose frequency on mineral loss and red fluorescence. Mineral loss from dentin plotted against intensity of red fluorescence (total amount of peaks within the red area of the spectrum) in arbitrary units. Biofilm age is indicated with different colors for the three times-a-day sucrose group (closed circles) and the eight times-a-day sucrose group (open circles). Remarkable is the increase in red fluorescence intensity at day 24 (red circles) in both groups. The thickness of all biofilms was 600 µm.

