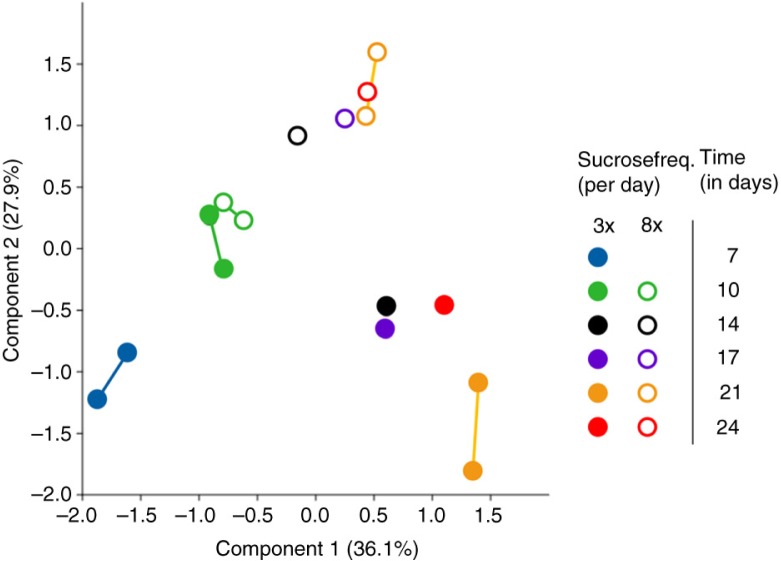
Fig. 4.
Principal component analysis (PCA) plot of microbiome samples from all time points. The drawn lines link two samples from the same condition group: at day 7 between different pans, at day 10 and 21 within one pan. Biofilm age is indicated with different colors for the three times-a-day sucrose group (closed circles) and the eight times-a-day sucrose group (open circles). The thickness of all biofilms was 600 µm.

