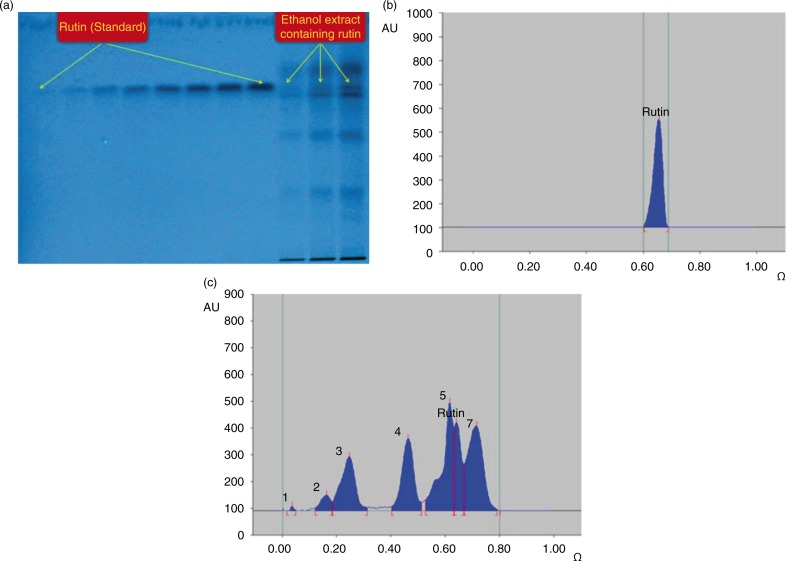
Fig. 5.
Quantification of rutin in A. javanica total ethanolic extract by HPTLC. (a) Pictogram of developed RP-HPTLC plate at 254 nm; mobile phase – acetonitrile: water (4:6, v/v). (b) Chromatogram of standard rutin (1,000 ng spot−1), peak 1 (Rf=0.65) scanned at 360 nm; mobile phase – acetonitrile: water 4:6, v/v). (c) Chromatogram of the extract containing rutin (peak 6) scanned at 360 nm; mobile phase – acetonitrile: water 4:6, v/v).

