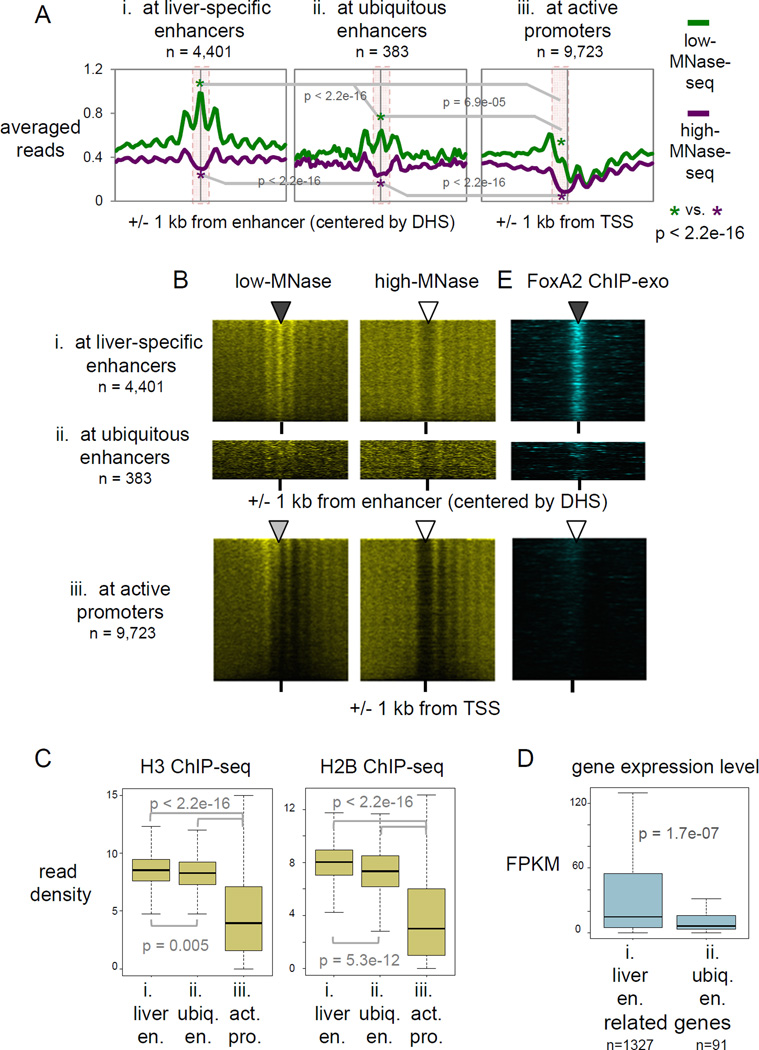
Figure 2. Liver-specific enhancers retain MNase-accessible nucleosomes genome-wide.
(A) Averaged profiles of low- and high-MNase-seq signal enrichments at, liver-specific enhancers ubiquitous enhancers, and active promoters. p-values by Wilcoxon rank-sum test at central 200 bp of enhancers and at upstream 200 bp from active TSS (pink box area). (B, E) Heatmaps of MNase-seqs and FoxA2 ChIP-exo at liver-specific enhancers, ubiquitous enhancers, and active promoters, rank ordered by low-MNase-seq read density. (C) Box and whisker plots show H3 and H2B ChIP-seq signal enrichment at central 200 bp of liver-specific and ubiquitous enhancers and at upstream 200 bp from active TSS. p-value by Wilcoxon rank sum test. (D) Gene expression levels of target genes of liver-specific and ubiquitous enhancers, based on predicted enhancer-promoter pairs (Shen et al., 2012). (See also Figure S2)

