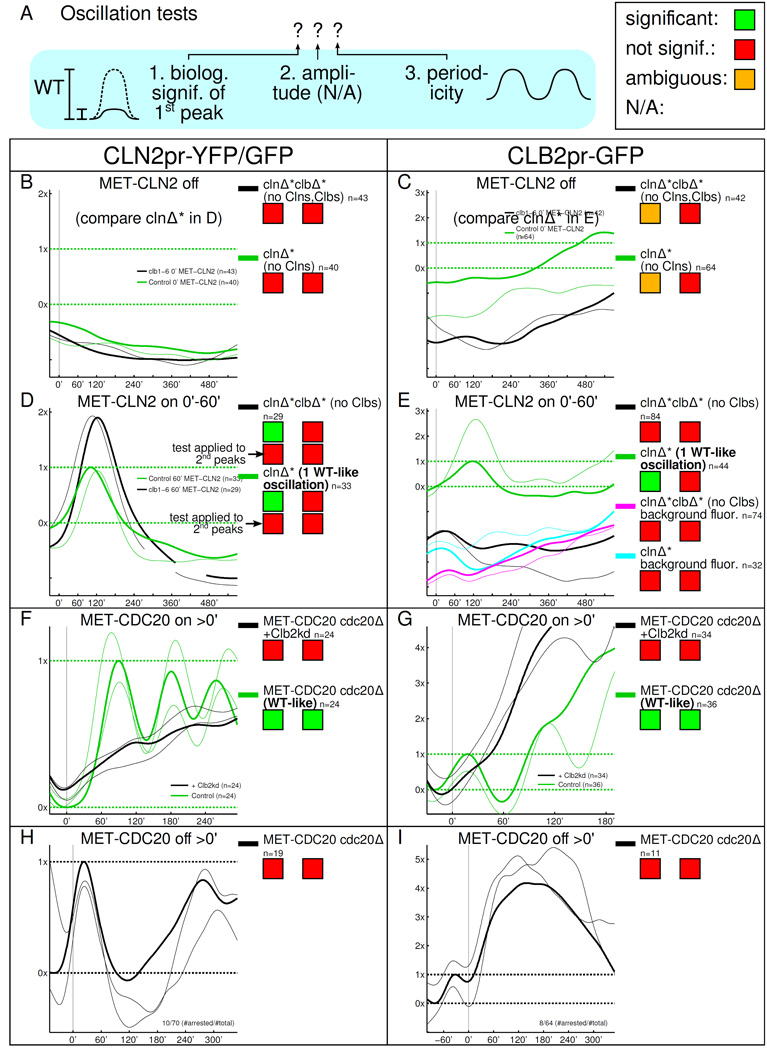
Figure 3.
Single-cell/single-gene time course measurements fail to show pulses predicted by the GTO model. A: Same scheme as in Fig. 2. The statistical amplitude test is not available for single-cell/single-gene recordings. B–I: Smoothed, thin lines: single cell recordings; thick lines: population mean. B–G: Units of fluorescence chosen so that 0× is the mean trough and 1× is the mean peak of the first normal control cell cycle oscillation. The WT-like oscillations for B and C are plotted in D and E, respectively. H, I: 0× and 1× are defined such that the last, pre-arrest mean cell cycle response runs though 0× and 1× (trough and peak). Time courses are aligned so that at 0', cells bud for the last time before arresting for at least 350'.

