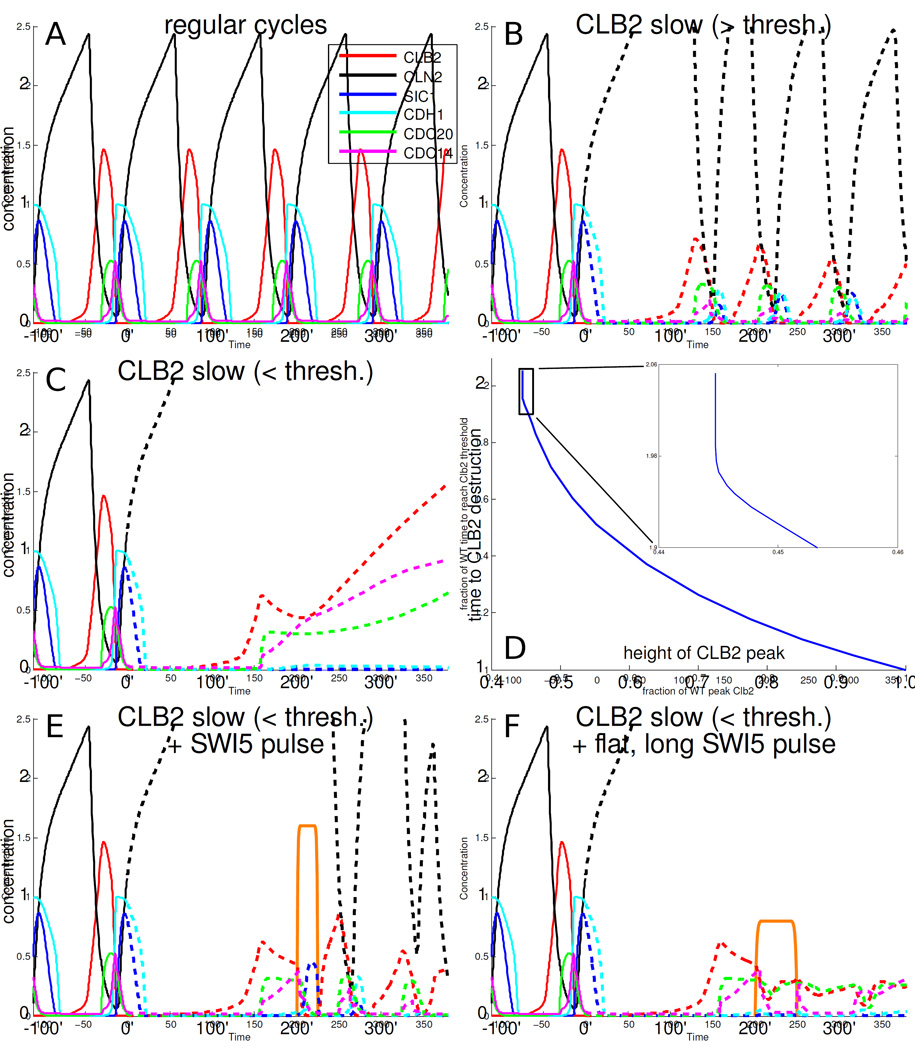
Figure 5.
The detailed model of the cell cycle from [Chen et al., 2004] shows that with low amounts of Clbs the cell cycle becomes trapped, and can be rescued by a (forced) pulse of Sic1. A: Normal cell cycle dynamics according to the model. B: When the rate of accumulation of Clb2 (red) is slowed down (dashed lines after 0'), the Clb2 peak occurs later and is smaller. C: With even slower Clb2 accumulation rates, Clb2 destruction becomes ineffective (also, the first Clb2 peak after 0' is smaller than in B). D: Above a certain threshold Clb2 accumulation rate (the height of the first Clb2 peak after 0' is larger), Clb2 destruction is successful (as in A and B), and below the threshold (small Clb2 accumulation rate, smaller Clb2 peak), Clb2 destruction is ineffective (as in C). The threshold is at about 45% of WT peak Clb2 levels. Time to Clb2 destruction and Clb2 peak height are normalized to the WT time and height in the model. Clb2 destruction time is defined as the time to return to a fixed, low Clb2 level (0.1). The time to Clb2 destruction is measured from 0'; the result is similar if the Clb2 destruction time is measured from the time of the Clb2 peak (Fig. S5 C). E: A sharp 25 min pulse of Swi5 (orange plot, equal in area to that of Swi5 in WT cycles) effectively turns off Clb2 and resets the cell cycle. F: Pulses of lower height but equal area are less effective at rescue; here, the height is reduced by half.

