
Fig. 2.
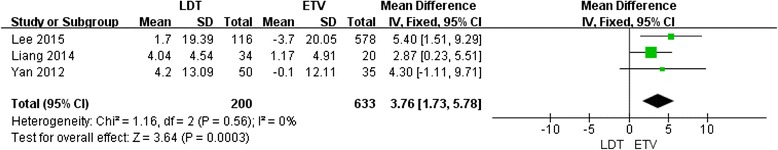
Forest plot of studies included: analysis the change in eGFR after 1 year of treatment in 3 studies directly comparing LdT with ETV
Official websites use .gov
A
.gov website belongs to an official
government organization in the United States.
Secure .gov websites use HTTPS
A lock (
) or https:// means you've safely
connected to the .gov website. Share sensitive
information only on official, secure websites.
Forest plot of studies included: analysis the change in eGFR after 1 year of treatment in 3 studies directly comparing LdT with ETV