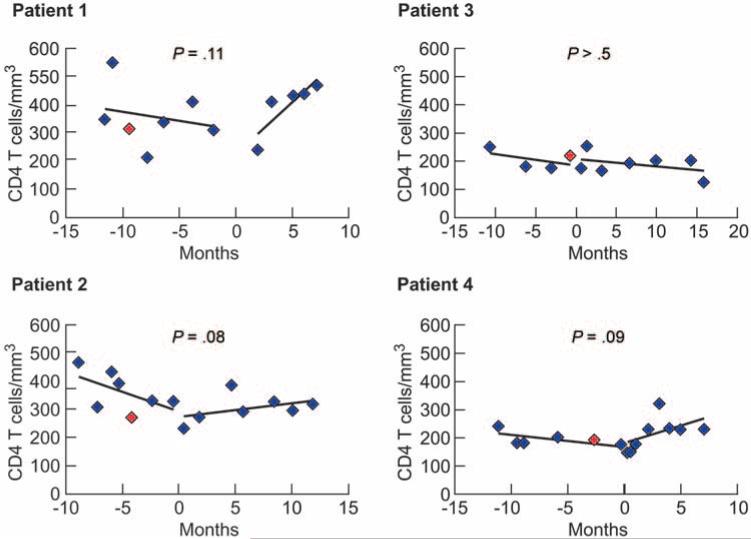
Figure 4.
CD4+ T cell counts after a change in antiretroviral therapy (ART). Counts were evaluated before (median, 11 months) and after (median, 10 months) a change in ART regimen (see separate lines in each panel). A break in the slope indicates the change in ART. P values represent the significance of the change in linear slope after a change in ART. Red symbols indicate the time of enrollment for each patient.

