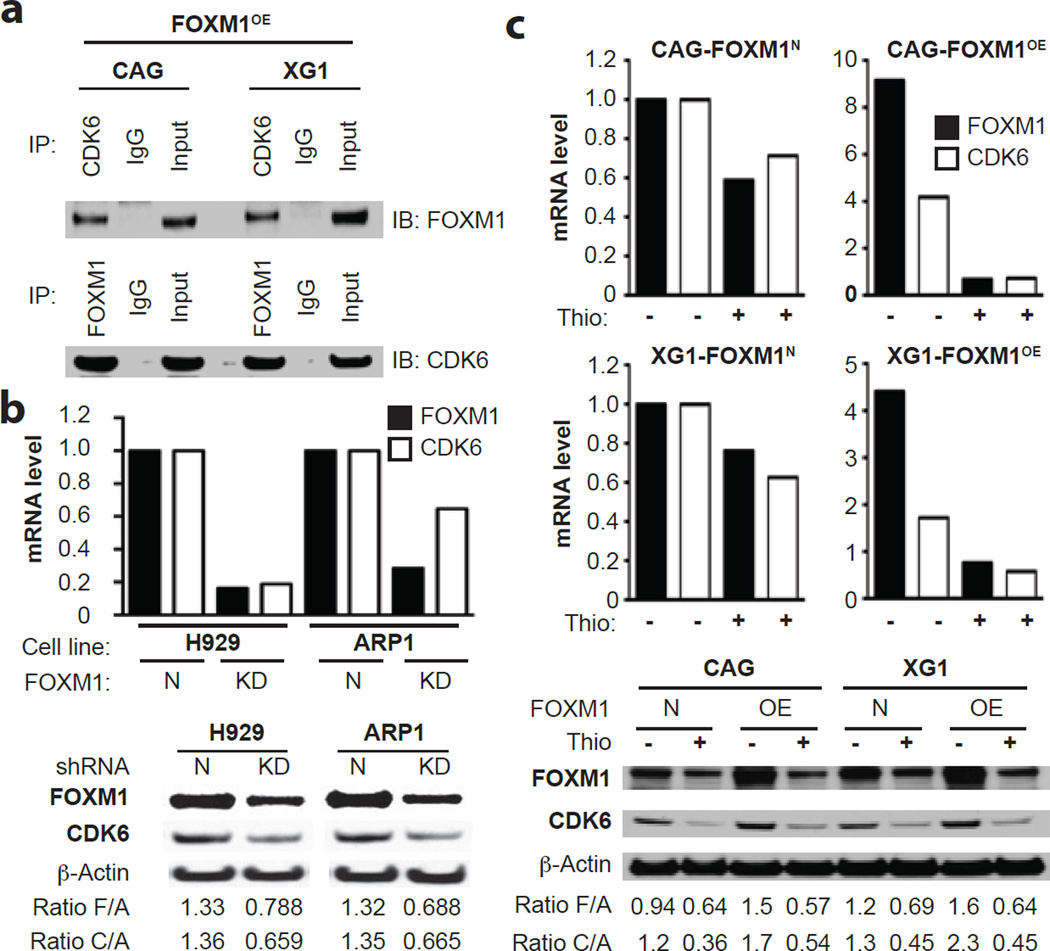
Figure 6. Physical interaction and co-expression of FOXM1 and CDK6 in myeloma cells.
(a) Co-immunoprecipitation (Co-IP) result indicating physical interaction of FOXM1 and CDK6 in FOXM1-overexpressing (OE) CAG cells (left) and XG1 cells (right). Immunoblots using specific antibodies (Ab’s) to FOXM1 (after IP using Ab to CDK6) or CDK6 (after IP using Ab to FOXM1) are shown on top of each other. IgG isotype controls (labeled “IgG”) and samples of whole cell lysates not subjected to Co-IP (labeled “Input”) were included as controls.
(b) FOXM1 message (black bars) and CDK6 message (white bars) determined by qRT-PCR (top) and corresponding protein levels determined by immunoblotting (bottom) in FOXM1KD and FOXM1N H929 (left) and XG1 (right) myeloma cells. The ratios of target proteins to the house keeping protein, β-actin, are indicated below the Western blots. F/A and C/A denote the ratios including FOXM1 and CDK6, respectively.
(c) FOXM1 and CDK6 mRNA (top) and protein (bottom) levels in FOXM1OE and FOXM1N CAG or XG1 myeloma cells treated with TS (+) or left untreated (-). F/A and C/A ratios are as in panel b.

