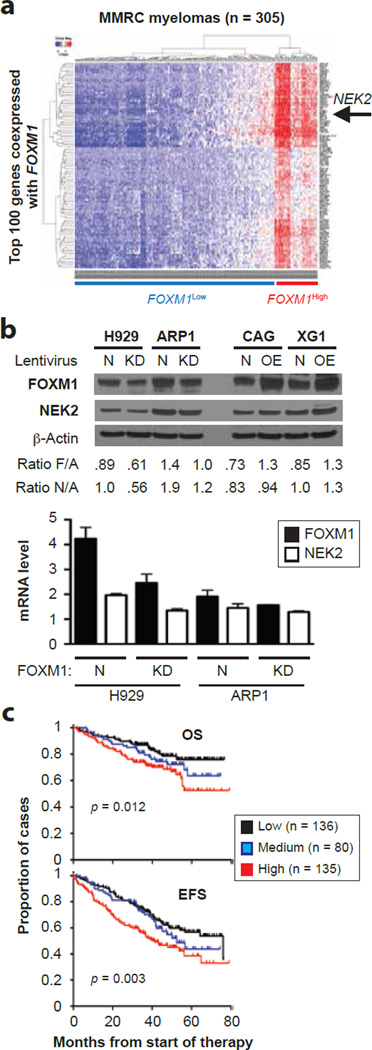
Figure 7. Coordinated expression of FOXM1 and NEK2 in myeloma cells.
(a) Co-expression of FOXM1 and NEK2 in the MMRC dataset (305 patients) publicly available at the Broad Institute’s Myeloma Genome Portal. The heat map contains the top 100 genes co-expressed with FOXM1. Each row and column represents one specific gene and patient, respectively. The position of NEK2, which is among the top 10 co-regulated genes, is indicated by a labeled arrow that points left.
(b) Shown at top is an immunoblot analysis of the FOXM1 and NEK2 protein levels in paired FOXM1KD/FOXM1N samples of H929 and ARP1 myeloma cells (left) or paired FOXM1OE/FOXM1N samples of CAG and XG1 myeloma cells (right). The ratios of target to house keeping protein (β-actin) are indicated below the Western blots: F/A for FOXM1 and N/A for NEK2. Presented at bottom is the result of a qRT-PCR analysis of FOXM1 and NEK2 expression in FOXM1KD and FOXM1N H929 (left) and ARP1 (right) cells, demonstrating that genetic down regulation of FOXM1 leads to a corresponding drop in NEK2 message.
(c) Expression levels of FOXM1 and NEK2 are associated with survival in TT2 myeloma patients. Cases were stratified as high or low expressers when both FOXM1 and NEK2 message were above (indicated in red) or below (black) the medium level in the TT2 dataset. All remaining cases (i.e., FOXM1High/NEK2Low or FOXM1Low/NEK2High) were designated as medium expressers (blue). Event-free survival (EFS) and overall survival (OS) in all 3 groups was plotted and statistically compared using log-rank analysis.

