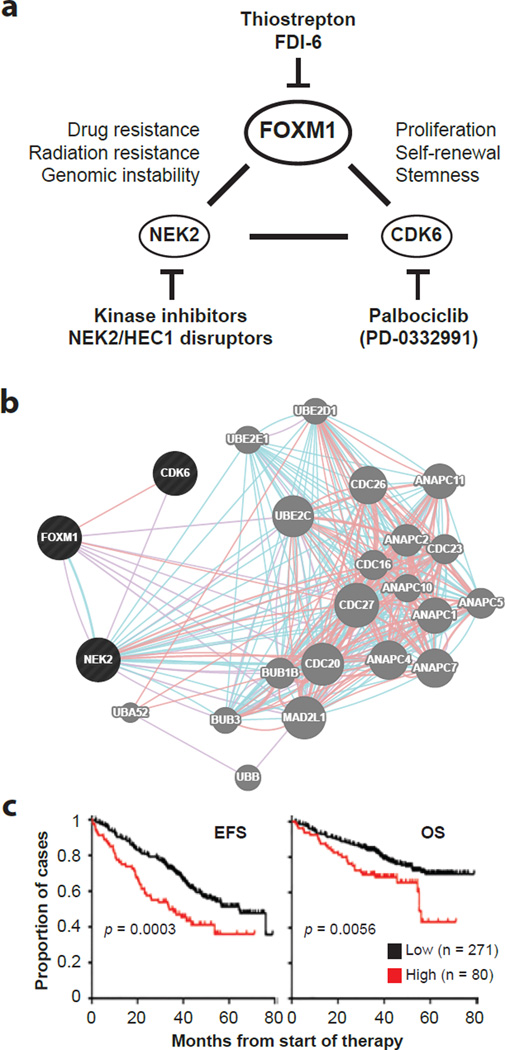
Figure 8. FOXM1 may interact with CDK6 and NEK2 to shorten survival of patients with high-risk myeloma.
(a) Working model on the interaction of FOXM1, CDK6 and NEK2 in myeloma. Although FOXM1 is most firmly established as a proliferation-associated gene, new findings indicating that FOXM1 governs self-renewal and tumorigenicity of cancer stem cell-like cells in glioblastoma25, and that the FOXM1 target, CDK6, serves as a key regulator of leukemia stem cell activation64, raise the possibility that the interaction of FOXM1 and CDK6 in myeloma is also important for stemness. Additionally, FOXM1 may collaborate with NEK2 to drive resistance of myeloma cells to cancer therapy, given that NEK2 has been implicated in acquired drug resistance of many cancers48–50 and specifically shown to activate certain ABC drug transporters in myeloma48. Specific inhibitors of all 3 genes have been developed. Palbocicblib has already demonstrated activity in clinical trials on myeloma.
(b) Genetic interaction network of FOXM1, CDK6 and NEK2 (indicated in black to the left) generated with the help of the GeneMANIA online tool. Blue and pink lines denote pathways and physical interactions, respectively. Network genes are indicated by grey circles to the right that are labeled. The network’s apparent enrichment for ubiquination genes (not shown) points to the proteasome, suggesting in turn that the FOXM1-CDK6-NEK2 network core is involved in the response of myeloma cells to proteasome inhibition, a widely used treatment for myeloma.
(c) Kaplan-Meier plots of event-free survival (EFS, left) and overall survival (OS, right) of patients with myeloma from the TT2 cohort stratified according to high levels (red) or low levels (black) of FOXM1, CDK6 and NEK2 message upon microarray analysis. Myelomas containing higher than median amounts of mRNA of all three genes were designated as high (n = 80), whereas myelomas that did not meet this criterion were designated as low (n = 271). The differences in survival were significant using log-rank analysis (p < 0.05).

