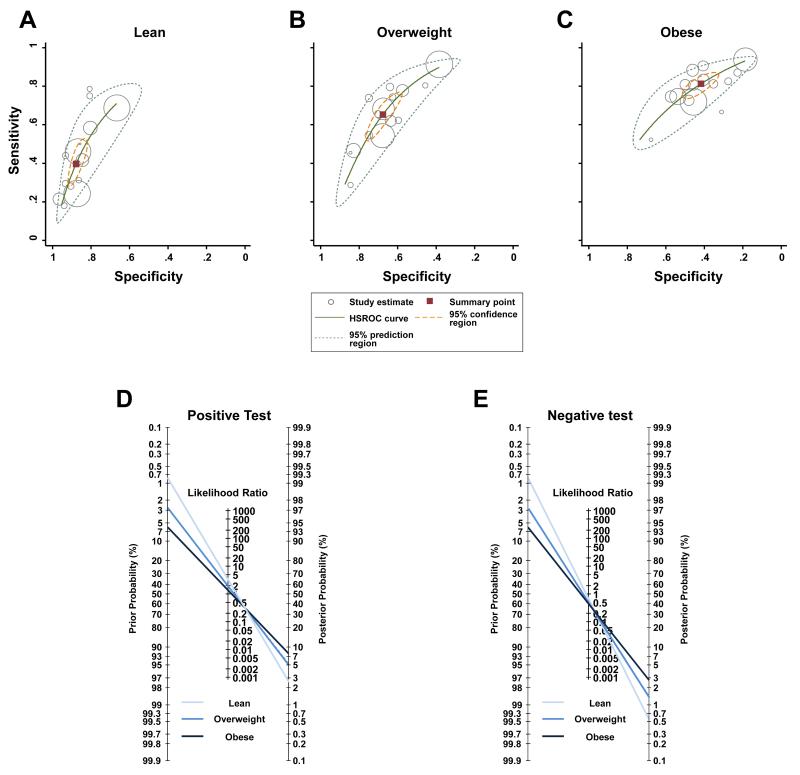
Figure 3. Performance of metabolic health definitions in the prediction of future development of type 2 diabetes.
The top Panels report hierarchical summary receiver operating characteristic (HSROC) curves of the predictive performance in lean (Panel A), overweight (Panel B) and obese (Panel C) individuals. Solid squares represent pooled estimates; open circles, individual study estimates with a size that is proportional to the weight of each study; solid lines, HSROC curves; broken lines delimit uncertainty in the estimates of the summary points (95% confidence region) or of the HSROC curves (95% prediction region). In Panels D and E, Fagan’s nomograms represent scenarios of positive (i.e. metabolically unhealthy; Panel D) or negative (i.e. metabolically healthy individual; Panel E) results of the binary classification of metabolic health in body mass index categories.

