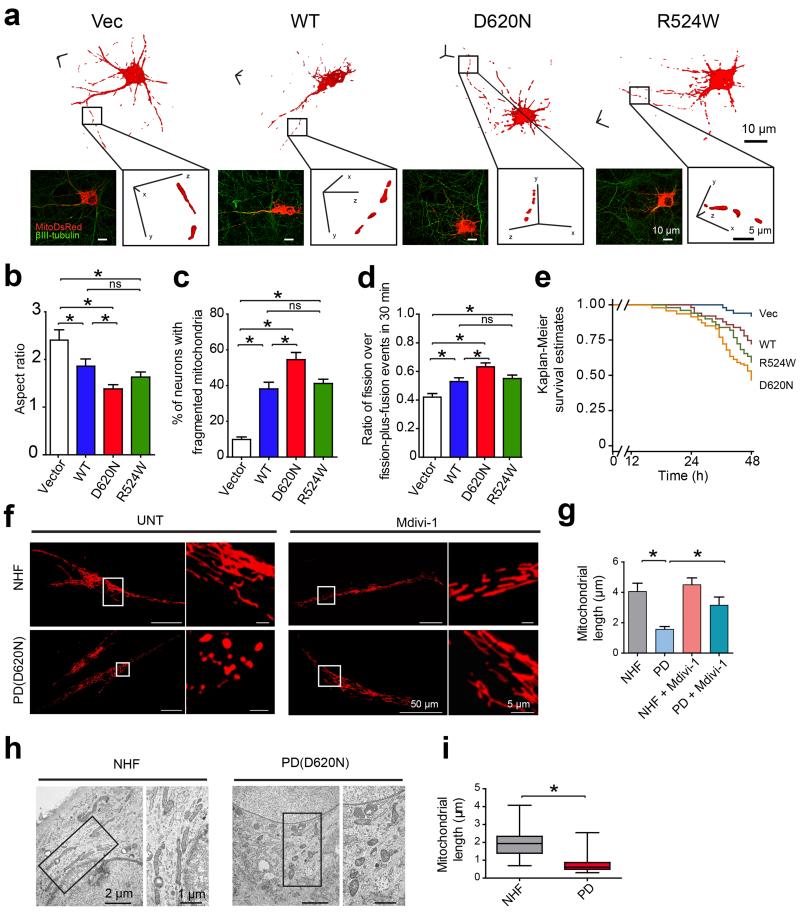
Figure 1. VPS35 regulates mitochondrial dynamics in vitro.
(a) Representative three dimensional (3D) pictures of mitochondria in rat cortical neurons co-transfected with constructs encoding indicated flag-tagged VPS35 and mitoDsRed2. A segment of axon (boxed area) was enlarged. Vec: empty-vector control; WT: wild type. Quantification of mitochondrial aspect ratio (b) and percentage of neurons with fragmented mitochondria (c) (n = 35, 32, 40, 43 for Vector, WT, D620N and R524W neurons respectively). (d) The ratio of fission over fission-plus-fusion events in live neurons expressing VPS35 and mitoDsRed2 (n = 43, 33, 37, 38 for Vector, WT, D620N and R524W neurons respectively). (e) Measurement of neuronal viability in cortical neurons expressing GFP, VPS35 and mitoDsRed2 (n = 51, 46, 55, 51 for Vector, WT, D620N and R524W neurons respectively). Representative confocal images (f) and quantification of mitochondrial length (g) in fibroblasts from PD subject bearing D620N mutation [PD(D620N)] and normal human fibroblasts (NHFs) with or without mdivi-1 treatment. (n = 34, 44, 27, 53 for NHF, PD, NHF + Mdivi-1 and PD + Mdivi-1 fibroblasts respectively). Representative EM micrographs of mitochondria (h) and quantification of mitochondrial length (i) in fibroblasts from PD subject with D620N mutation and NHFs. Boxed areas were enlarged to the right of each picture. [A total of 149 and 151 mitochondria from 5 randomly selected NHFs and PD(D620N) fibroblasts were analyzed]. Data are means ± SEM from three independent experiments. Statistics: one-way analysis of variance (ANOVA) followed by Tukey’s multiple comparison test. *P < 0.05. ns, not significant.

