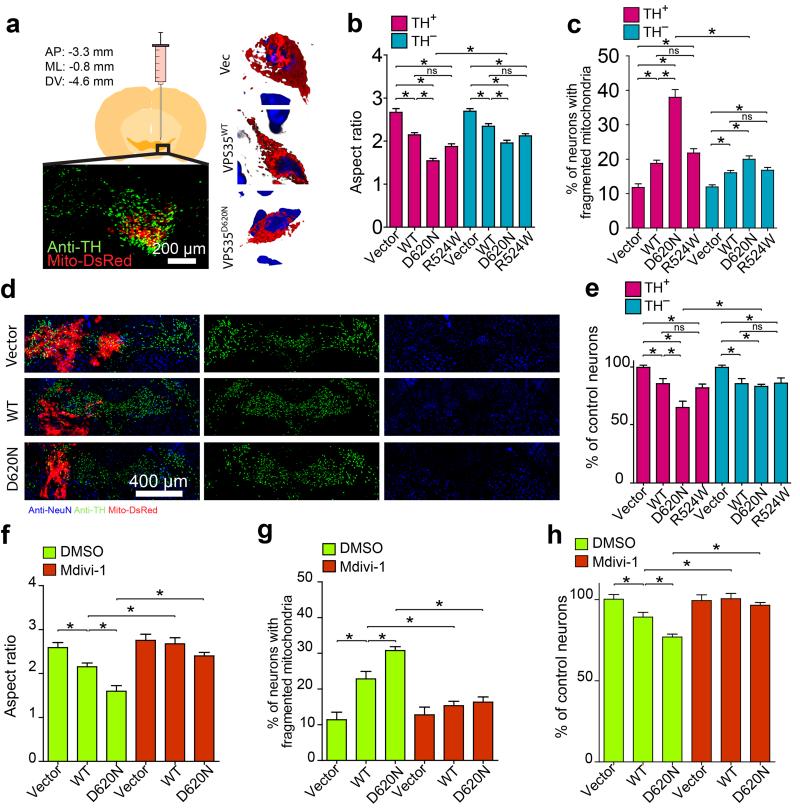
Figure 2. VPS35 regulates mitochondrial dynamics in vivo.
(a) Left: Schematic and representative picture showing the mitochondria (red) in positively transfected TH-positive neurons (green) through stereotactically injection of lentivirus encoding lenti-VPS35-p2a-mitoDsRed2 virus unilaterally into the ventral tegmental area (VTA) of a mouse. Right: Representative 3D image of mitochondria (red) in a TH-positive neuron in the FVB mouse injected with indicated vector (Vec: empty-vector control; VPS35wt, wild-type VPS35; VPS35D620N, D620N VPS35 mutant). Blue: DAPi. Quantification of mitochondria aspect ratio (b), the percentage of neurons with fragmented mitochondria (c) and neuronal loss (e) in both TH-positive and TH-negative neurons in FVB mice (2–3 months old) injected with indicated construct (n = 20, 23, 19, 21, 31, 36, 35, 31 for Vector, WT, D620N, R524W TH-positive and TH-negative neurons respectively from three FVB mice/group). (d) Representative images of immunofluorescent co-staining of substantia nigra with anti-NeuN (blue) and anti-TH (green) and mitoDsRed2 in FVB mouse injected with indicated construct. (f-h) Injected FVB mice were subject to Mdivi-1 treatment and mitochondrial aspect ratio (f), the percentage of neurons with fragmented mitochondria (g) and neuronal loss (h) in TH-positive neurons were analyzed after sacrifice (n = 25, 26, 27, 28, 22, 24, for Vector, WT, D620N, Vector + Mdivi-1, WT + Mdivi-1 and D620N + Mdivi-1 respectively from three mice/group). n represents number of neurons per group. Data are means ± SEM. Statistics: one-way analysis of variance (ANOVA) followed by Tukey’s multiple comparison test. *P < 0.05. ns, not significant.

