Figure 6.
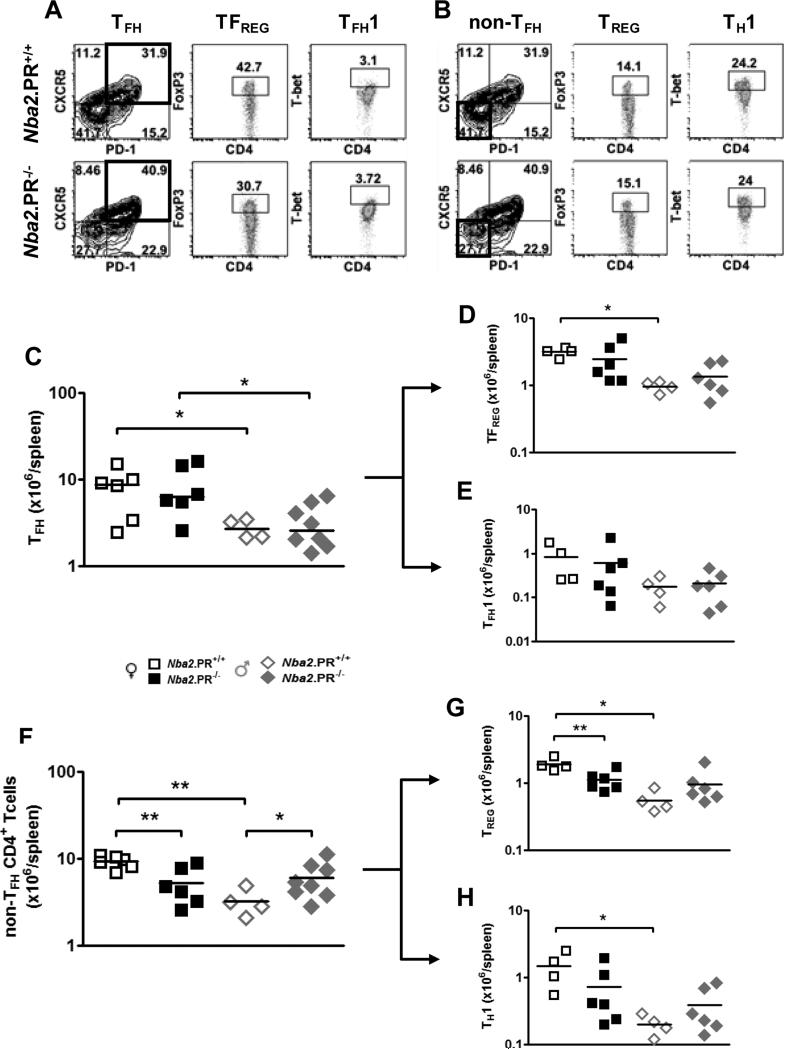
PR deficiency leads to decreased splenic TREG abundance in 10 mo.-old female Nba2 mice. Representative FACS plots show gating scheme used to sort CD3+CD4+ cells into TFH cells and their TFREG, and TFH1 subsets (A), and non-TFH CD4+ T cells into their TREG and TH1 subsets (B); TFH = CD3+CD4+CXCR5+PD-1+; TFREG = CD3+CD4+CXCR5+PD-1+FoxP3+; TFH1 = CD3+CD4+CXCR5+PD-1+Tbet+; non-TFH = CD3+CD4+CXCR5−PD-1−; TREG = CD3+CD4+CXCR5−PD-1−FoxP3+; TH1 = CD3+CD4+CXCR5−PD-1−Tbet+. (C – H) Shown are means (lines) and individual values (symbols) for splenic abundance of TFH cells (C) and their TFREG (D) TFH1 (E) subsets, and non-TFH CD4+ T cells (F) and their TREG (G) and TH1 (H) subsets. *, p < 0.05, **, p < 0.01, unpaired t test.

