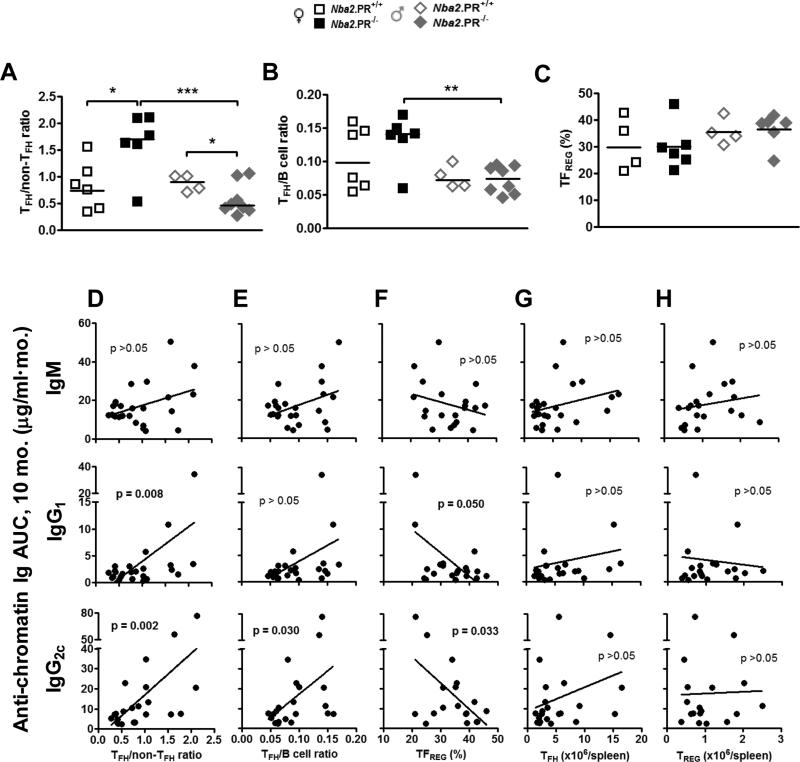
Figure 7.
PR deficiency increases the ratio of TFH cells to non-TFH CD4+ T cells in 10 mo.-old female Nba2 mice but decreases this ratio in age-matched male Nba2 mice. Shown are medians (lines) and individual values (symbols) for TFH/non-TFH CD4+ T cell ratios (A), TFH/B cell ratios (B) and TFREG percentage of TFH cells (C). *, p < 0.05; **, p < 0.01 unpaired t test of log-transformed data (A and B) or untransformed data (C). (D – H) Linear regression analysis of serum anti-chromatin Ig AUC levels at 10 mo. vs. TFH/non-TFH CD4+ T cell ratio (D), TFH/B cell ratio (E), TFREG percentage of TFH cells (F), TFH cells/spleen (G), and TREG cells/spleen (H) in all mice. P values for linear regression analyses are shown within each graph.

