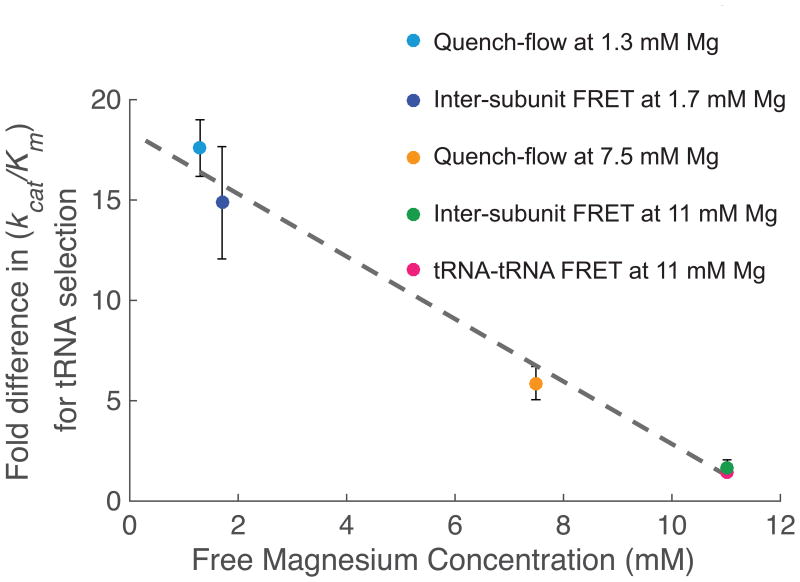
Figure 4.
The effect of m6A in delaying tRNA incorporation scales measured across methods. Comparing fold difference in m6A-induced delay in tRNA shows agreement across different methods. Inter-subunit FRET at 1.7mM Mg data point corresponds to data from Figure 2, while Quench-flow at 1.3 mM and 7.5 mM Mg data points corresponds to data from Figure 3 and Figure 4, respectively. Inter-subunit FRET at 11 mM magnesium concentration was measured taking ratio between two fittings of single-exponential distributions to time between 50S joining event and Lys-(Cy5)tRNALys arrival event happening near simultaneously with increase in inter-subunit FRET efficiency, for both AAA and (m6A)AA (number of molecule analyzed = 113 and 80, for AAA and (m6A)AA, respectively). The error for this measurement is calculated by the propagation of error method from s.e.m calculated in these two experiments. tRNA-tRNA FRET at 11mM Mg data point has been measured as indicated in the text.

