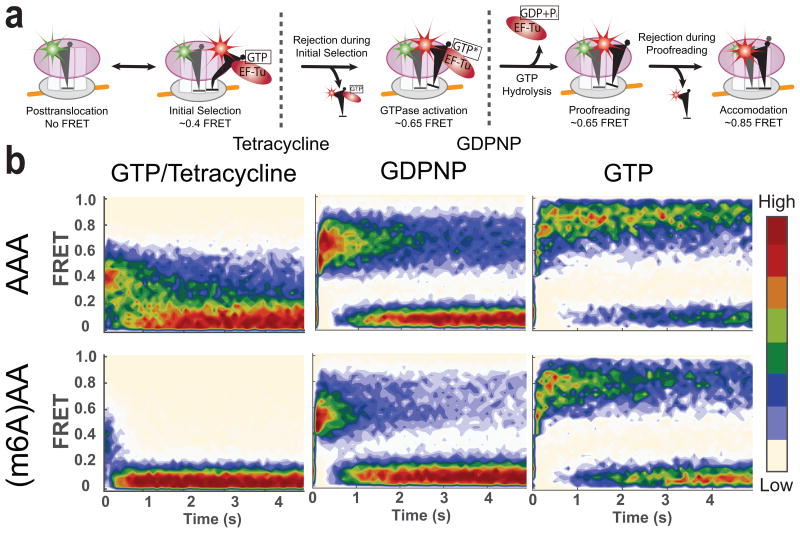
Figure 5.
Effect of m6A on different stages of decoding observed using tRNA-tRNA FRET. (a) A model of tRNA selection steps and corresponding approximate FRET values. Monitoring FRET between fMet-(Cy3)tRNAfMet and Lys-(Cy5)tRNALys can be used to track the tRNA selection process. (b) Contour plots of the time evolution of population FRET at various conditions, generated by superimposing all the observed FRET events (in the case of the GTP experiment (left panels), first observed event per immobilized molecule) synchronized to the start of the event defined by the FRET efficiency larger than 0.35. Contours are plotted from tan (lowest population) to red (highest population). The number of FRET events post-synchronized for each experiment is 350, 350, 948, 1573, 520 and 396 for experimental conditions with GTP–and–AAA, GTP–and–(m6A)AA, GDPNP–and–AAA, GDPNP–and–(m6A)AA, GTP–and–tetracycline–and–AAA and GTP–and–tetracycline–and–(m6A)AA, respectively.

