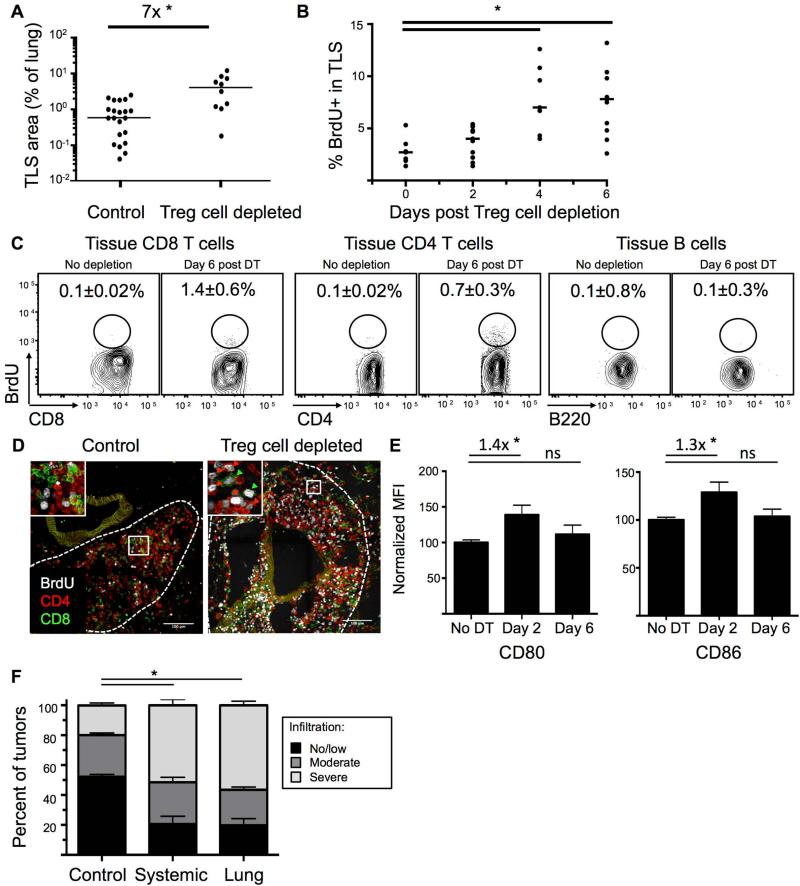
Figure 5. TLS is a site of immune activation following Treg cell depletion.
~20-wk LucOS/Cre LV-infected KP-F mice were treated IP (A-F) or IT (F) with DT. (B-D) mice treated with BrdU to label proliferating cells.
(A) Graph quantifying TLS / lung size of 22 control and 10 day-12 Treg cell-depleted mice. *, p=1.8×10⁻⁴.
(B) Graph shows the percent of BrdU+ lymphocytes in TLS after Treg cell depletion. Day 0, no DT. Points are the average of lymphocytes in all the TLS in a section. Bar: median. See also Figure S6A. n=7, days 0 and 4 and n=11, days 2 and 6. *, p<0.005.
(C) FACS plots show BrdU staining in lung-tissue CD8 and CD4 (FoxP3neg) T cells and B220+ CD19+ B cells. Average of 3 control and 6 Treg-depleted mice ± SEM.
(D) Confocal IF images show control (n=18/9 TLS/mice) and day 6 Treg cell-depleted (n=57/12) TLS. Green, CD8; red, CD4; white, BrdU. Arrowheads: BrdU+ CD8 (green) and CD4 (red) T cells.
(E) Graphs show median (± SEM) CD80 and CD86 MFI (median fluorescence intensity) on lung-tissue CD11b+ CD11c+ MHCII+ DCs. n=8, no DT; n=12, day 2; n=13, day 6 post DT. Fold change indicated. ns=non-significant. *, p<0.05.
(F) Graph shows blind quantification of IHC on lung sections from control (n=630/23), day-12 IP DT treated (systemic depletion, n=136/15 tumors/mice), and day-12 IT DT treated (lung-restricted depletion, n=266/11) mice stained for CD45 and NKX2.1. no/little, < 30%; moderate 30-50%; severe, >50% CD45+ cell infiltration. *, p<0.005.

