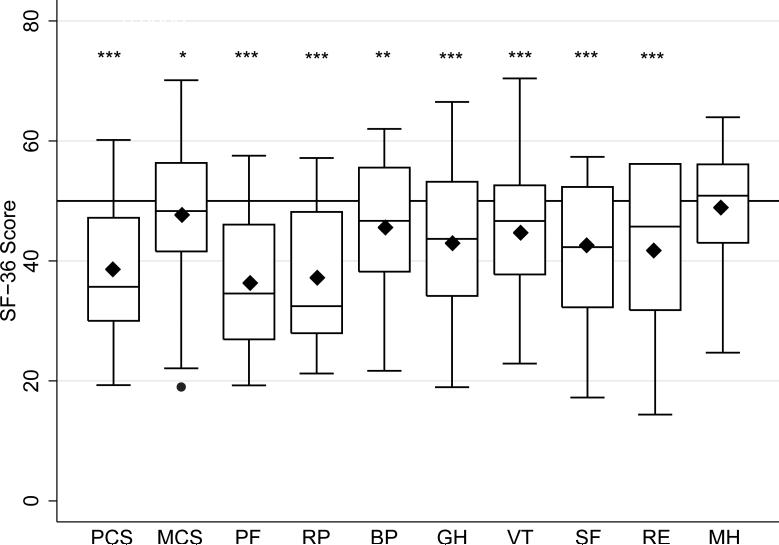
Figure 1.
SF-36 profile for the sample of OPMD patients (N=89 ). Box-and-whisker plots of norm-based scores. Medians (horizontal bars), 25th-75th percentiles (box), ranges (whiskers), means (black diamonds), and outliers (black dot) are shown. Horizontal reference line at a score of 50 represents the U.S. general population mean. Significance levels of comparisons between sample means and the US general population mean are shown.
* P<0.05, ** P<0.001, ***P<0.0001. (PCS=Physical Component Summary, MCS= Mental Component Summary, PF=physical functioning, RP=role limitation due to physical problems, BP=bodily pain, RE=role limitations due to emotional problems, VT=vitality, GH=general health perception, MH=mental health, and SF=social functioning.)

