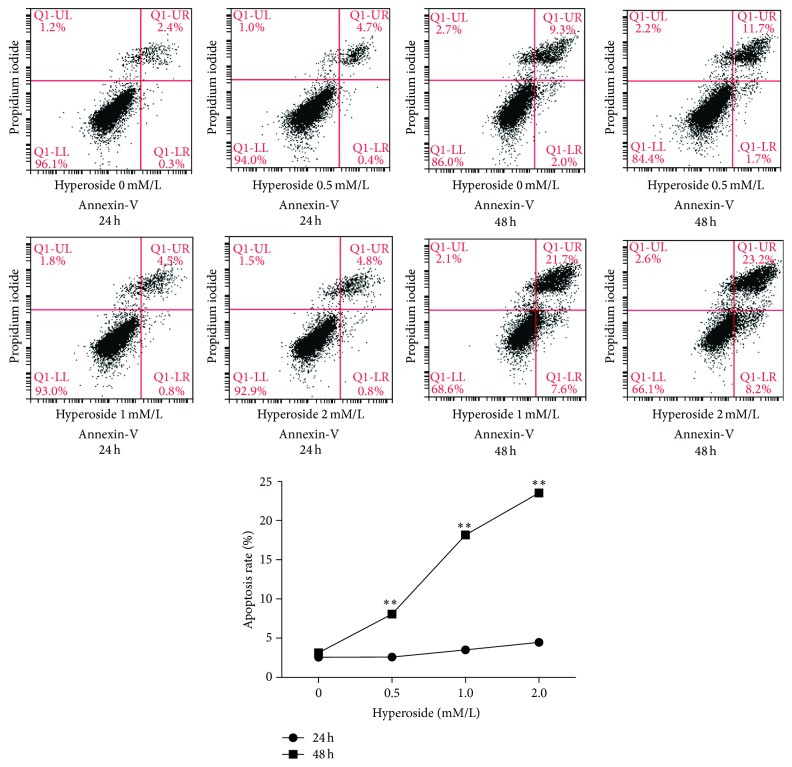
Figure 2.
Hyperoside induced proapoptosis effect and its statistical representation of data. The apoptosis rate of Lx-2 cells was analyzed by flow cytometry (Annexin V-FITC/PI). Cells were treated with different dose of hyperoside (0, 0.5, 1.0, and 2.0 mM/L) for 24 h and 48 h, respectively. Results represent the mean ± SEM from three independent experiments (∗∗means compared with the control group, P < 0.001, n = 3).

