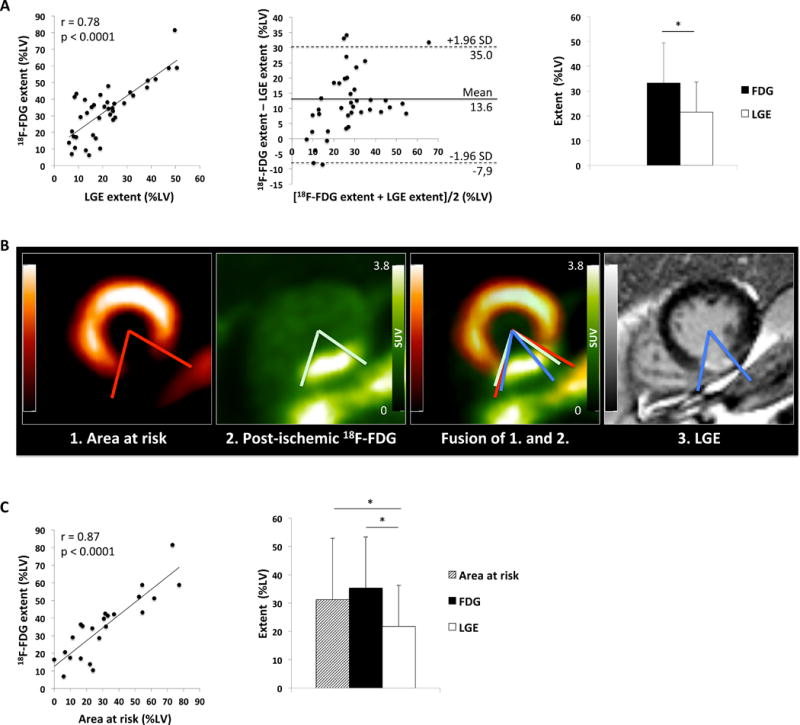
Figure 3. Comparison of 18F-FDG extent, LGE extent, and area at risk.

A: Correlation between quantitative 18F-FDG extent (%LV) and LGE extent (%LV) (left). Bland-Altman-Plot of the difference between 18F-FDG extent (%LV) and LGE extent (%LV) against the mean of both measures (middle). Comparison of 18F-FDG uptake area and LGE area in all 39 patients with (*p<0.0001) (right).
B: Short axis views of 99mTc-sestamibi SPECT depicting the area at risk, 18F-FDG PET, fusion of the two and LGE MR images of a patient with inferior myocardial infarction. The area at risk nicely matches the post-ischemic 18F-FDG uptake, while both measures are larger than the LGE extent.
C: Correlation between quantitative 18F-FDG extent (%LV) and area at risk (%LV) (left). Comparison of 18F-FDG uptake extent, LGE extent and area at risk in 23 patients with 99mTc-sestamibi-SPECT (right, 18F-FDG vs. LGE, *p<0.0001; Area at risk vs. LGE *p<0.004).
