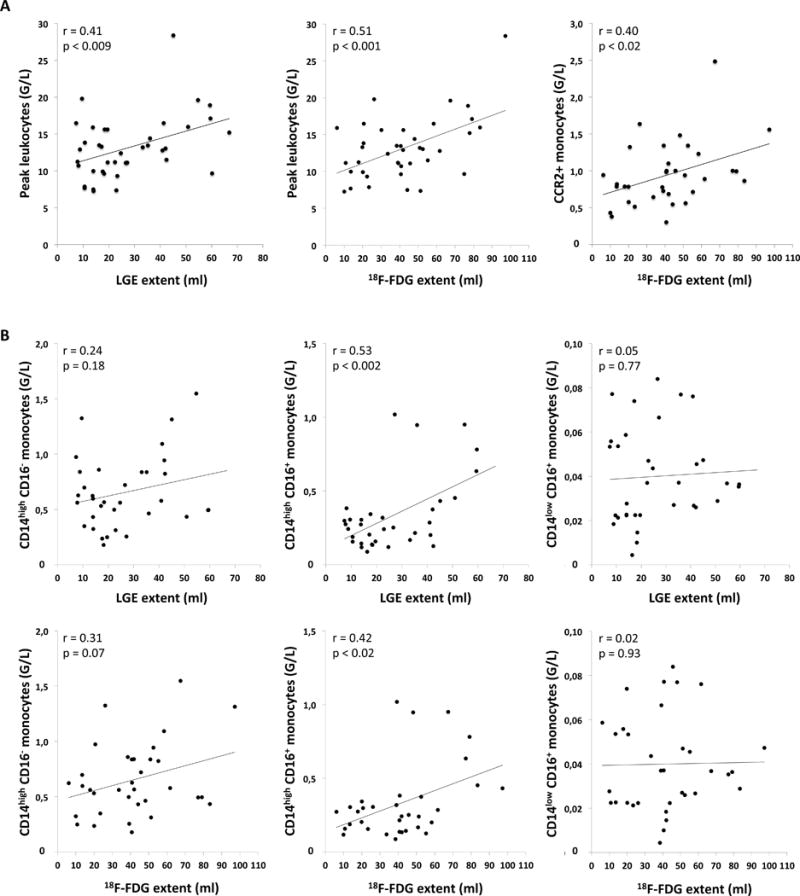
Figure 4. Peak leukocytes, CCR2+ monocytes and monocyte subpopulations in relation to LGE and 18F-FDG extent.

A: Correlation between infarct size and peak leukocytes after infarction (left), 18F-FDG extent and peak leukocytes (middle), and 18F-FDG extent and CCR2+ monocytes early after myocardial infarction (right). (G/L = 109 cells per liter).
B: CD14highCD16− (inflammatory), CD14highCD16+ (intermediate), and CD14lowCD16+ (reparative) monocyte subpopulations determined during the first 3 days after AMI in relation to the LGE extent and 18F-FDG extent. (G/L = 109 cells per liter).
