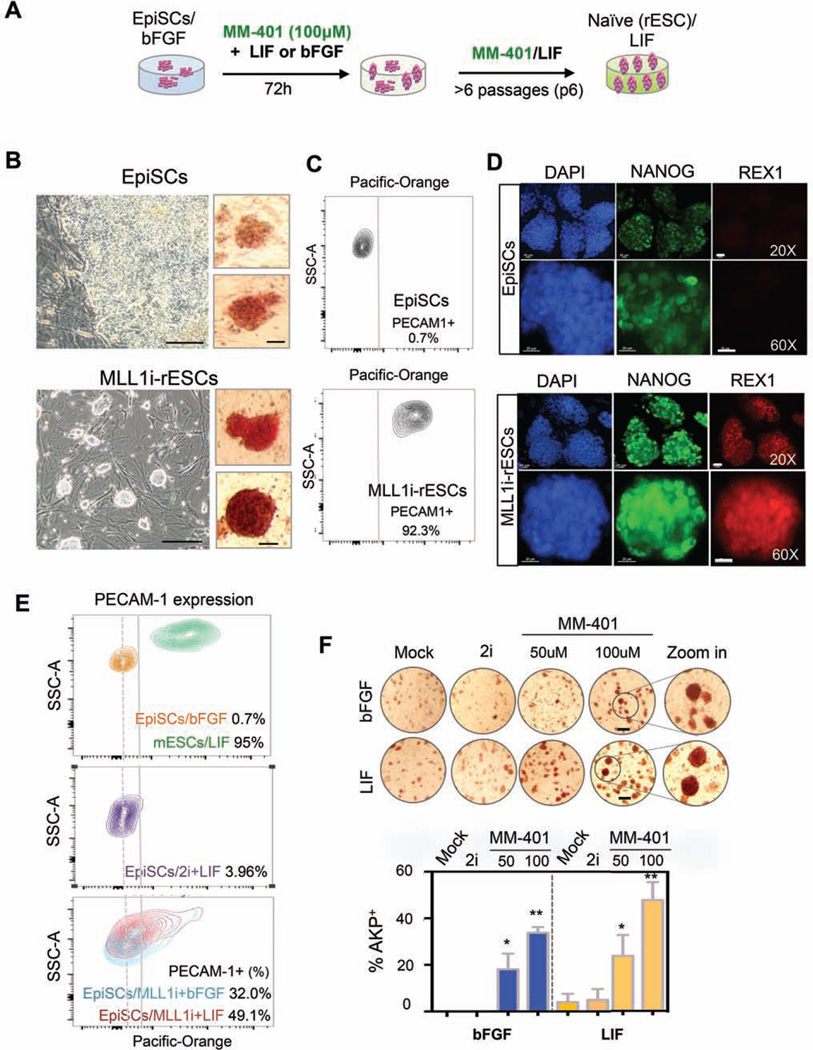
Figure 1. MM-401 efficiently reprograms EpiSCs to ESCs.
A. Schematics of EpiSC reprogramming experiments. B. Representative images of EpiSCs with (bottom) or without MM-401 (top) at passage 6. Left, phase contrast; scale bar, 100µm. Right, AKP+ staining; scale bar, 20µm). C. FACS for PECAM1 in EpiSCs (top) and MLL1i-rESCs (bottom). Gray line, gating for PECAM1+ cells. Dash line, high frequency peak of EpiSCs distribution in PECAM-1 staining. D. Immunofluoresence staining for EpiSCs and MLL1i-rESCs as indicated. Scale bar, 20µm. E. Contour plots of PECAM1 FACS signal in ESCs, EpiSCs and MM-401 treated EpiSCs. Dash line indicated gating for PECAM1+ cells. F. AKP staining of cells as indicated. bFGF/KSR or LIF/KSR media were used as indicated on left. 100–210 clones were quantified for AKP++ and morphology change under each condition. Experiments were repeated at least twice. Scale bar, 200µm. This Figure is related to Supplemental Figure S1, S2 and S3.

