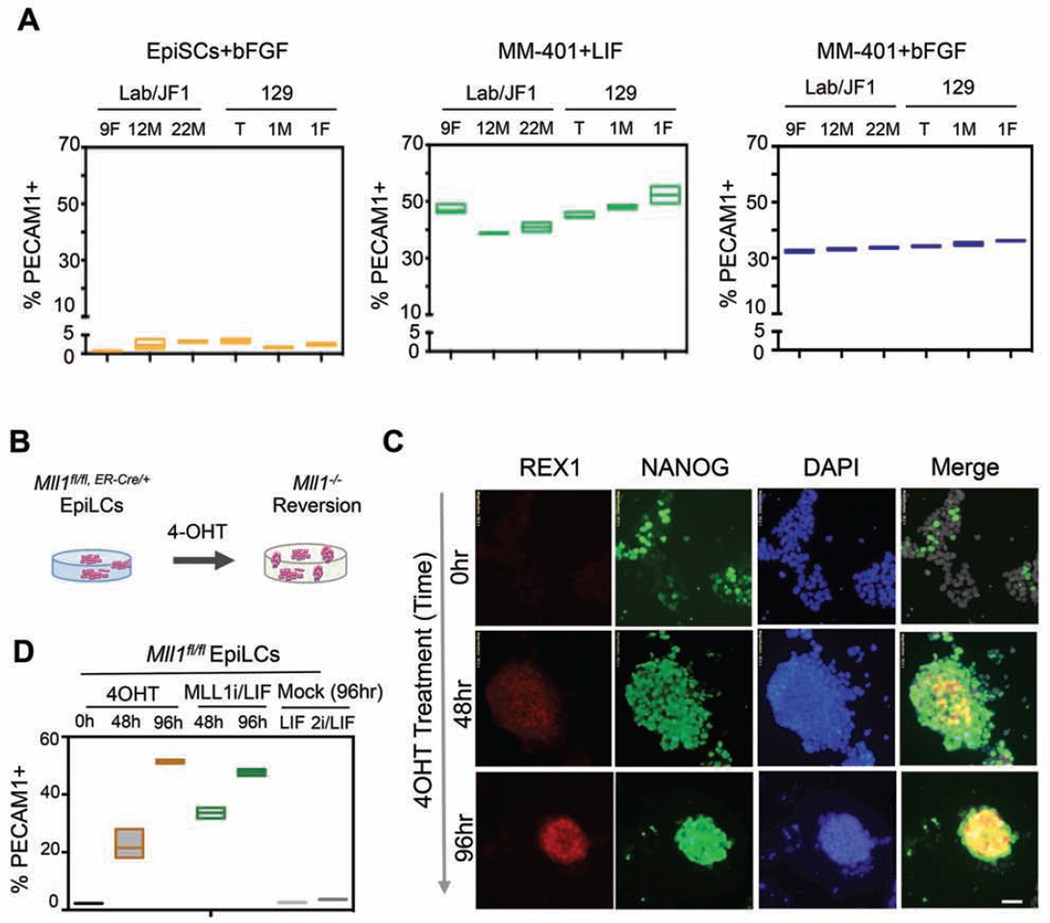
Figure 3. MLL1 deletion is sufficient to reprogram EpiLCs.
A. FACS for PECAM1 in 6 EpiSC lines that were mock or MM-401 treated as indicated. Y-axis, percent of PECAM1+ cells. B. Schematics for 4-OHT-induced Mll1 deletion. C. Immunofluorescence for NANOG and REX1 after 4-OHT treatments. DAPI was used as counterstain. Scale bar, 20µm. D. FACS for PECAM1 in cells as indicated on top. For A and D, top and bottom edges of the box represents maximum to minimum changes, respectively. Middle line represents mean of three independent experiments. This Figure is related to Figure S3.

