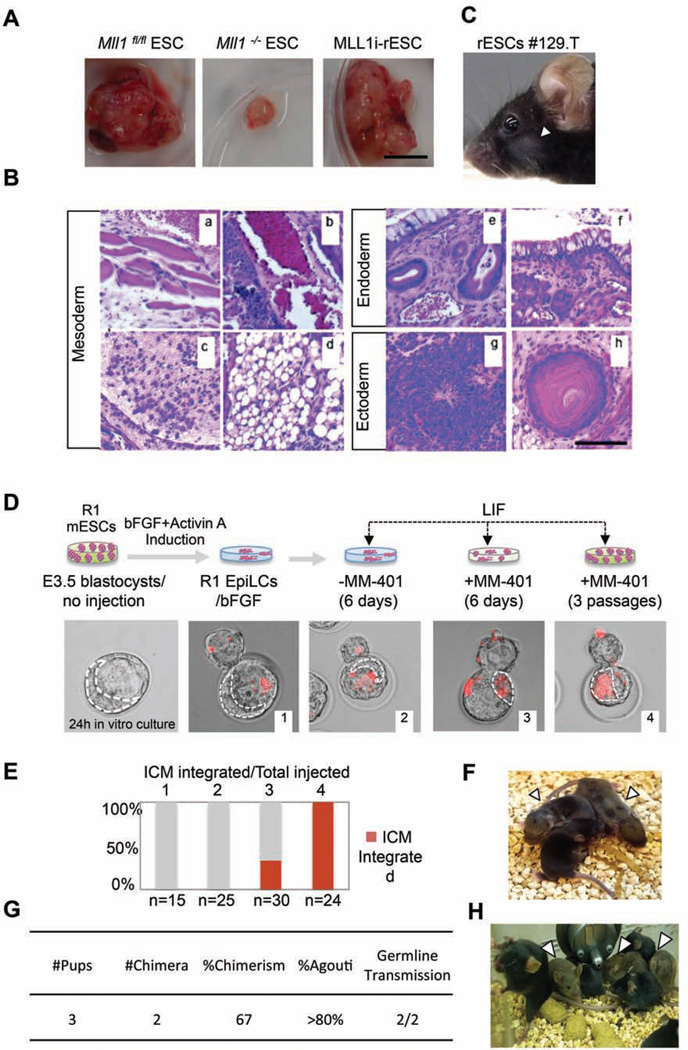
Figure 4. MLL1i-rESCs are developmentally competent in vivo.
A. Teratomas generated from engrafted cells as indicated on top. Scale bar, 1cm. B. Hematoxylin and Eosin (H&E) staining of MLL1i-rESC teratoma sections. (a) Muscle; (b) Blood vessel; (c) Cartilage; (d) Adipose-like tissue; (e) respiratory-like epithelium; (f) Gastrointestinal-like epithelium; (g) Neural epithelium; (h) Hair follicle. Scale bar, 500µm. C. F1 chimeric mouse from 129.T MLL1irESCs injected blastocyst. D. Top, schematic of ICM incorporation experiments. Bottom, representative merged fluorescent/phase contrast images of blastocysts after microinjection. Red, dye-labeled R1-EpiLCs. Dash line, inner cell mass (ICM) analyzed by CY5.5 filter. E. Quantification of ICM incorporation in D. 1, R1-EpiLCs/bFGF; 2, R1-EpiLCs/LIF; 3, R1-EpiLCs treated with MM- 401/LIF for 6 days; 4, R1-EpiLCs treated with MM-401/LIF for 3 passages (12 days). Y-axis, % of ICM with labeled rESCs. The number of microinjected blastocysts was indicated on bottom. F. F1 chimera from host mice engrafted with Mll1i-R1-rESC containing blastocyst. G. Summary of chimeric contribution in F1. H. F2 progenies from chimeric F1 mice. In C, F and G, arrowheads show agouti coat color. This Figure is related to Figure S4.

