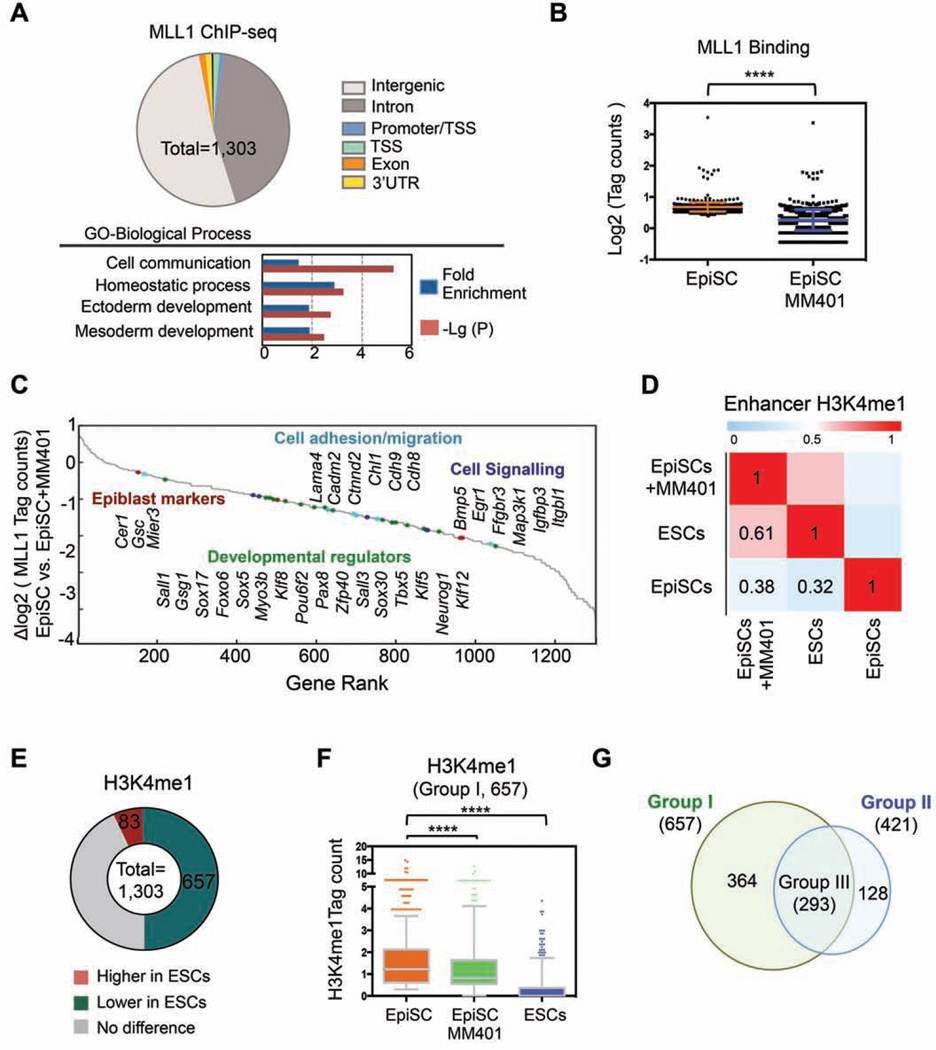
Figure 6. MLL1 regulates dynamic H3K4me during pluripotent stem cells conversion.
A. Top, MLL1 distribution in EpiSCs relative to gene structure. Bottom, Panther pathway analyses on the annotated MLL1 direct targets. B. MLL1 binding in EpiSCs treated with or without MM-401. Y-axis shows the compiled log2 tag counts within MLL1 peak center ± 200bp. Data is presented as mean ± s.d. ****, p<0.0001 in Mann-Whitney test. C. Gene rank based on changes in MLL1 binding after MM-401 treatment. D. Pearson correlation of H3K4me1 in two pluripotent states (n=103,748). H3K4me1 in ESCs (GSE47949) and EpiSCs (GSE57407) were from public database. E. Changes of H3K4me1 at MLL1 binding sites in ESCs vs. EpiSCs. F. Box plots for H3K4me1 level in EpiSCs, ESCs and EpiSCs treated with MM-401. Y-axis, H3K4me1 tag counts within MLL1 peak center ± 200bp. 657 genes defined in E were included in this analyses. In Box plot, central mark represents median value and edges represent 25th and 75th percentiles of H3K4me1 level. The whiskers extended to 5th to 95th percentile and outliers are plotted individually. ****, p<0.0001 in Mann- Whitney test. G. Venn diagram for genes that had lower H3K4me1 in ESCs (Group I) or lower H3K4me1 in EpiSCs after MM-401 treatment (Group II). This Figure is related to Figure S5, S6 and Table S2–5.

