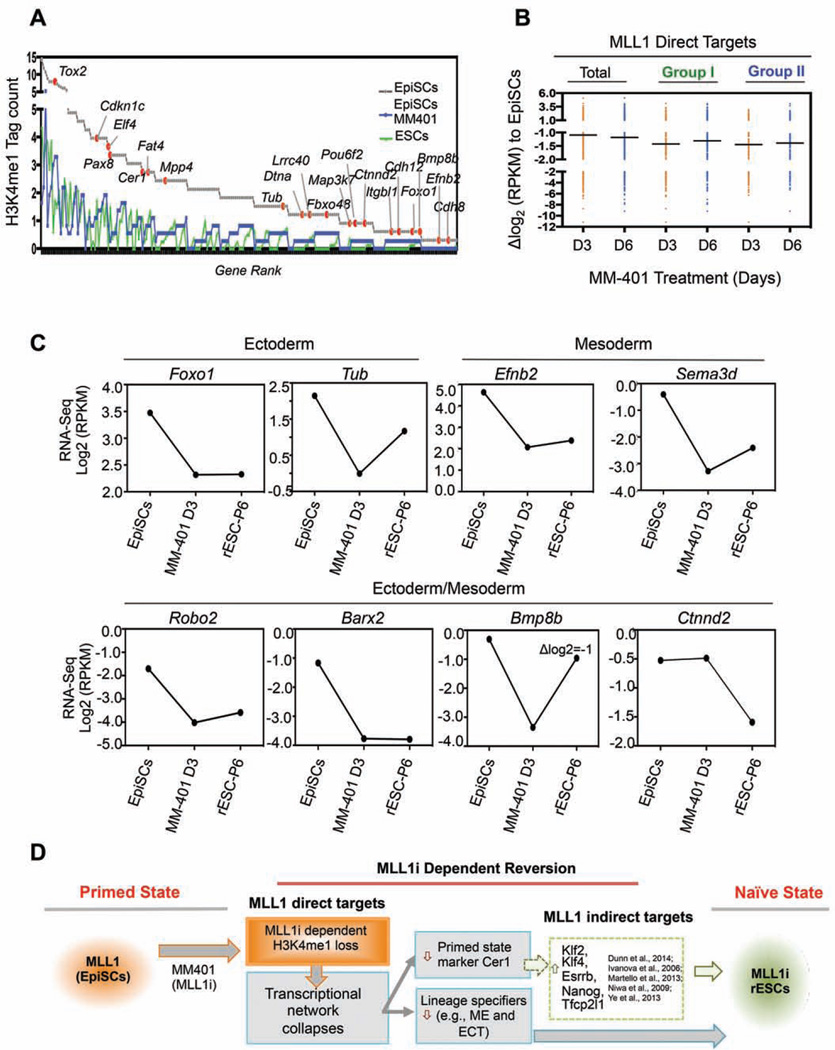
Figure 7. Direct MLL1 gene network in EpiSCs.
A. Gene rank of H3K4me1 tag counts at Group III genes in EpiSCs and their levels in ESCs and MM401-treated EpiSCs. B. Scattered plot for expression of Group I and Group II genes after MM-401 treatment at day 3 (D3) and day 6 (D6). Genes that had log2(fold change)>1 or <−1 were included in this analyses. For A and B, Group I and II are defined in Figure 6G. C. Expression of selected MLL1 direct targets during reversion. Average Log2(RPKM) from RNA-seq duplicates was presented after normalization. D. The model for the molecular roadmap of MM-401-induced EpiSC reversion. This Figure is related to Figure S7.

