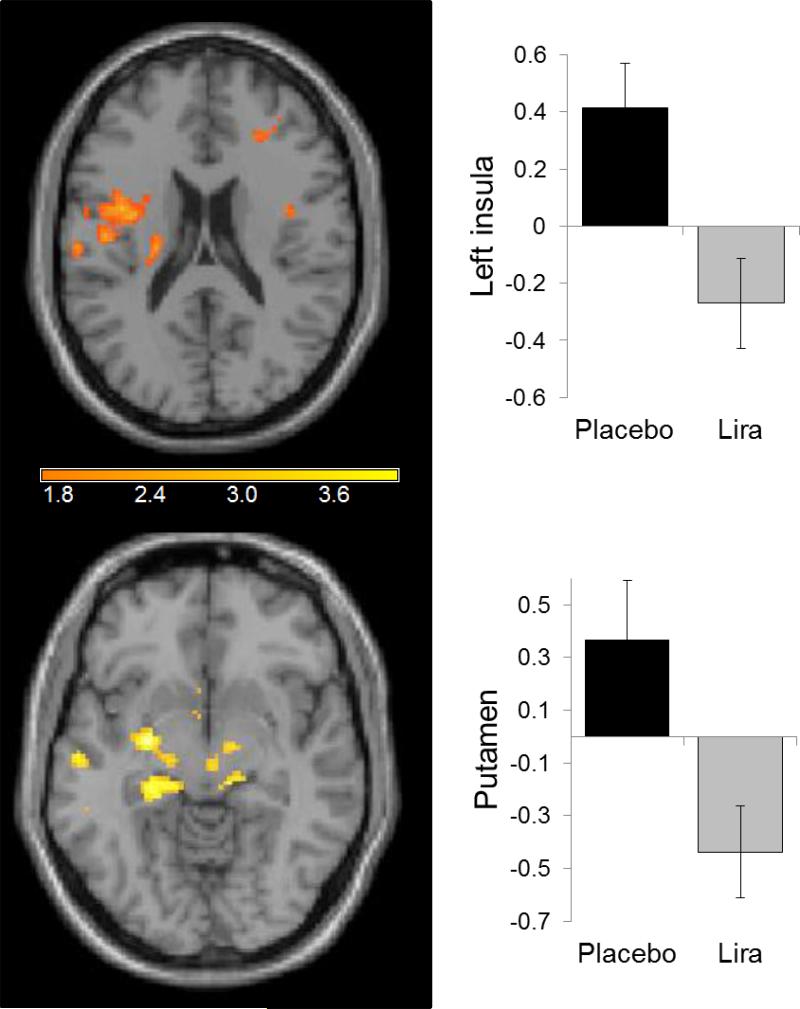
Fig. 4.
In a secondary analysis, small volume corrections on images for insula and putamen; to be compared with results from van Bloemendaal et al (Fig. 3) [15]. The y-axis represents effect size of the activation (z scores). BOLD contrasts are superimposed on a T1 structural image in neurological orientation. The colour bar represents voxel T value. Lira, liraglutide

