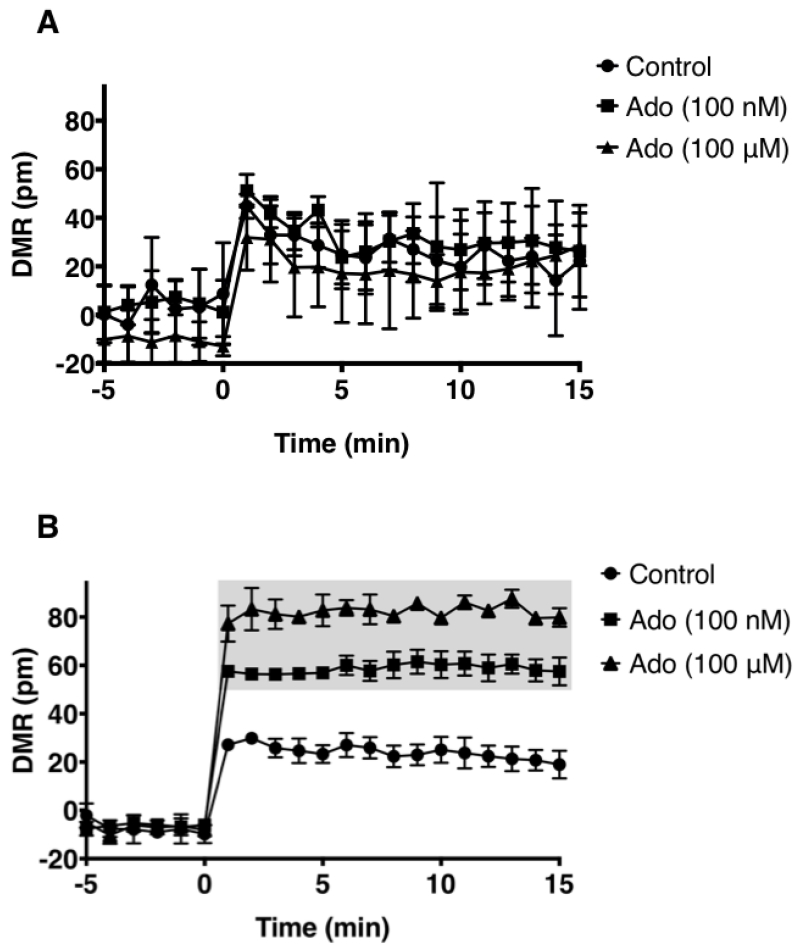
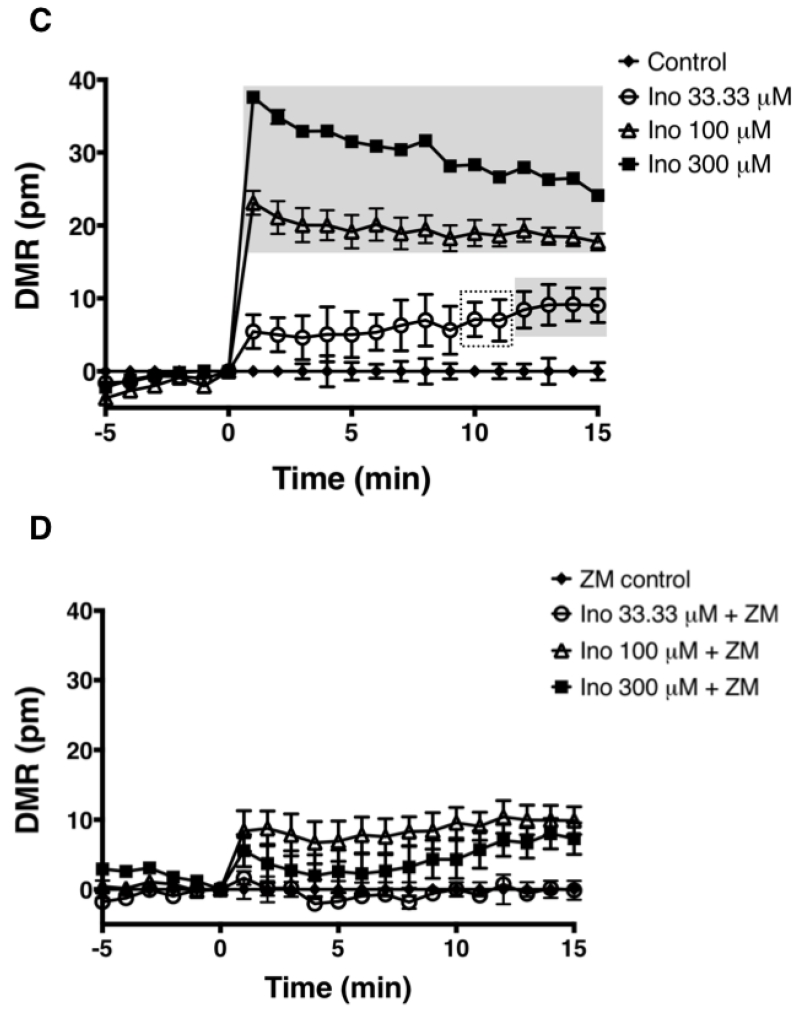
Fig. 1.
Dynamic mass redistribution analysis of ARs on CHO-K1 and CHO-hA2AR cells.
DMR response traces of CHO-K1 (A) and CHO-hA2AR (B, C & D) stimulated with indicated concentrations of adenosine (Ado; A & B), inosine (Ino; C & D) and 100 nM ZM 241385 (ZM; D). All data are mean values ± SEM of a representative independent experiment (n=3). Data with p < 0.001 and p < 0.05 relative to control are indicated in shaded and dotted boxes, respectively.


