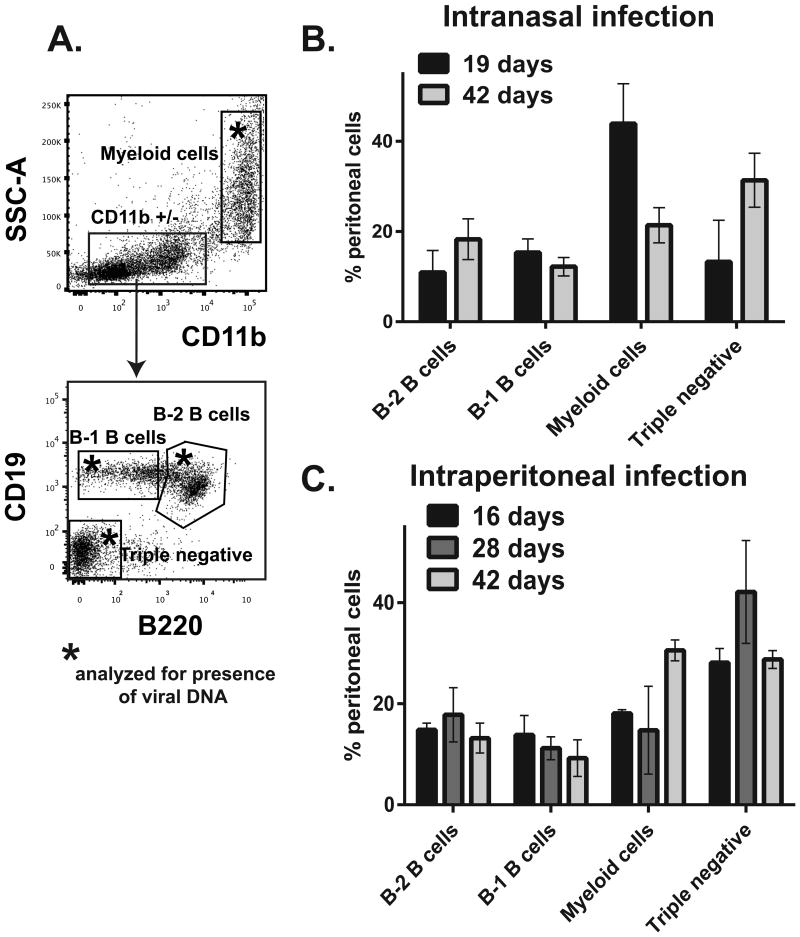
Figure 1. Peritoneal cell populations in MHV68-infected BL6 mice.
BL6 mice were intranasally or intraperitoneally infected with MHV68 (500 PFU/mouse and 1000 PFU/mouse, respectively); 5 mice per group were used in each experiment. At indicated times post infection, peritoneal exudate cells were harvested and pooled from all mice within the experimental group and analyzed by flow cytometry using markers in Table 1. A. Representative flow diagrams. Boxed populations with asterisk were analyzed for MHV68 DNA in subsequent analyses. B, C. Peritoneal immune cell populations at indicated times post infection. Data were pooled from 3-4 independent experiments.

