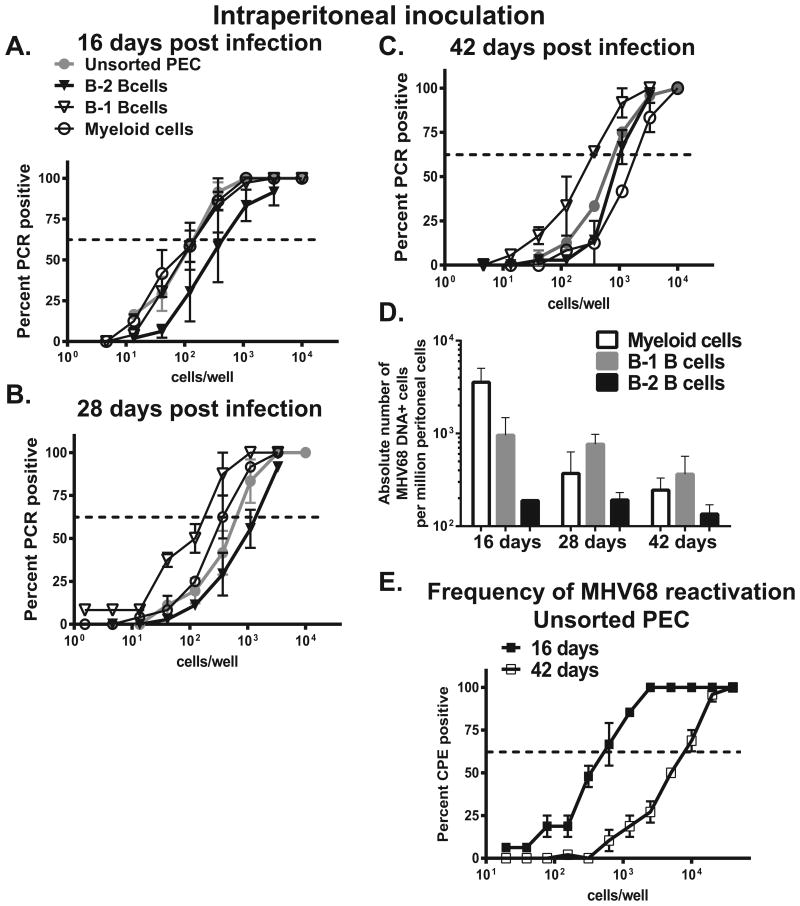
Figure 2. Distribution of MHV68 in peritoneal cell populations following intraperitoneal infection.
BL6 mice were intraperitoneally infected with MHV68 and peritoneal exudate cells harvested and pooled as described in Fig. 1. A-C. Sorted immune cell populations were subjected to limiting dilution PCR analysis to establish the frequency of MHV68 DNA positive cells. Data were pooled from 3-4 independent experiments. Average frequency of infected cells is shown in Table 1, absolute numbers of MHV68 positive cells in each population are shown in D. E. Frequency of viral reactivation was measured in unsorted peritoneal cells harvested at indicated times post infection, data were pooled from 3 independent experiments.

