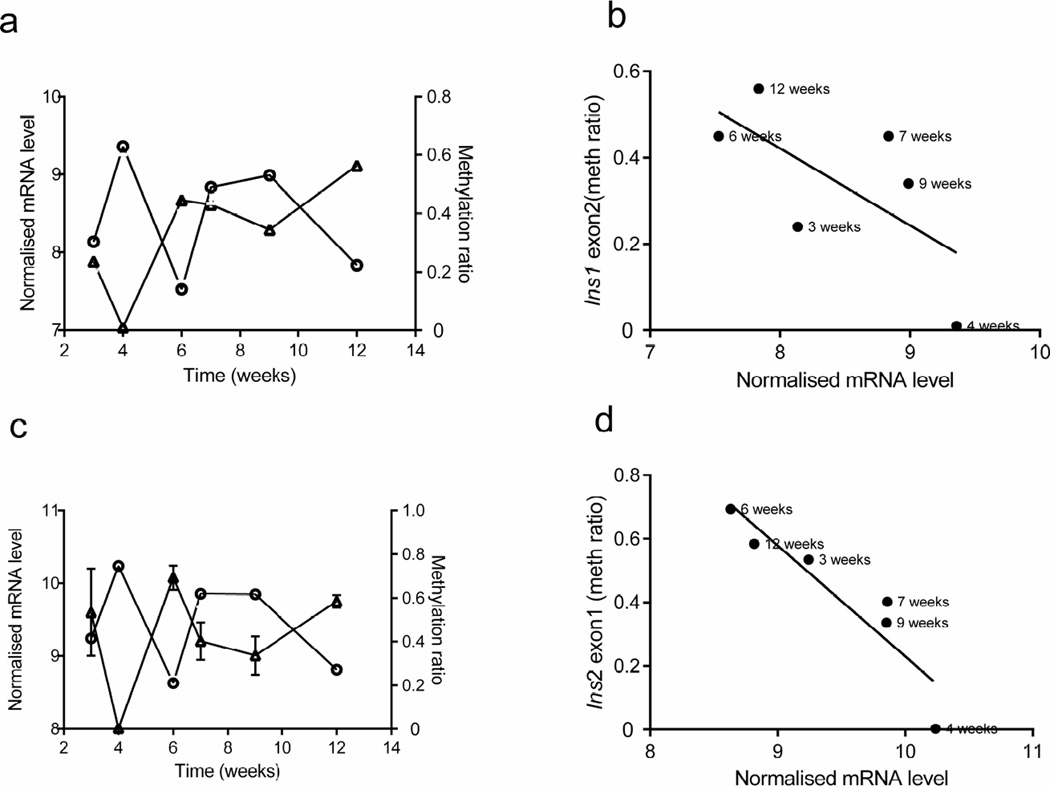
Fig. 4.
Correlation between insulin gene DNA methylation and transcription in beta cells from NOD mice over time. (a, c) The average methylation status of CpG sites within Ins1 exon 2 (a, triangles) and Ins2 exon 1 (c, triangles) in beta cells (as described in Fig. 3), together with Ins1 (a, circles) and Ins2 (c, circles) mRNA levels in the same cells (as described in Fig.2). (b, d) Correlations between the average methylation (meth) levels of Ins1 exon 2 and Ins2 exon 1 and the respective gene transcription Pearson’s correlation: (b) r2=0.43, p=0.1564; (d) r2=0.85, p=0.0089. Transcription data are the means ± SEM of 3 experiments with at least 4 mice in each age group

