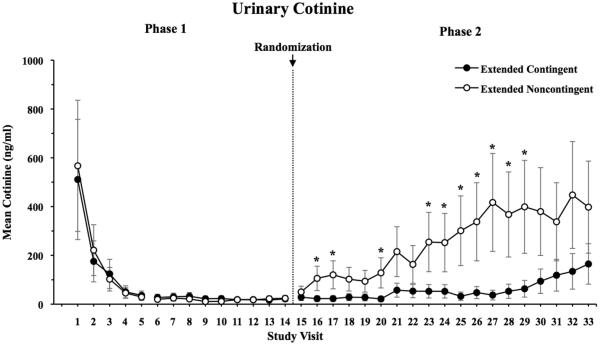
Figure 3.
Mean urine cotinine values (ng/ml) as a function of study visit. Data are presented for Extended Contingent (filled symbols) and Extended Noncontingent (open symbols) groups, with asterisks indicating a significant difference between experimental conditions at that study visit. Error bars represent SEM.

