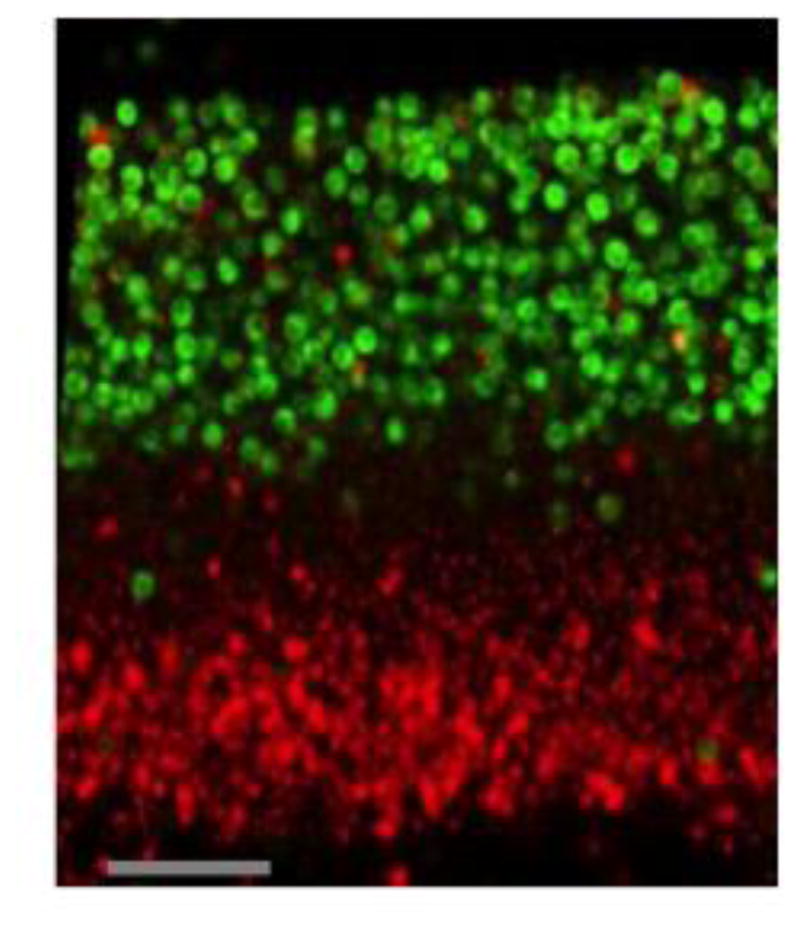
Fig. 1. Confocal image of PI-permeability and ime2Δ-GFP expression in colonies.

Colonies of strain SH4793 were grown for 4 d, stained with PI, and visualized by confocal microscopy.. Section shown is through the center of the colony, with the top of the colony at the top of the image. Red cells = PI, green cells= ime2Δ-GFP expression. PI and GFP images were collected separately and then merged (Image J). Scale bar = 50 μ.
