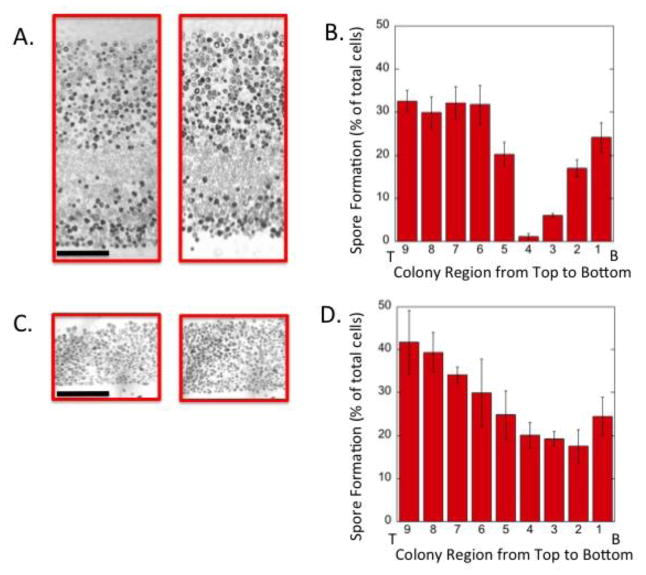
Fig. 2. Sections of yeast colonies grown on different concentrations of nitrogen source.
A) Sections of two colonies grown on YA medium (0.5% yeast extract) for 10 d, B) Distribution of sporulated cells in colonies grown as in A) determined by superimposing a grid containing nine equal-sized rectangles stacked on top of one another (long side horizontal) on each image scaled to just cover central region of colony from bottom to top. Distributions show percentage of the population recognized as asci in each of these rectangles from the top (T, left) to bottom (B, right) of the colony. C) Sections of two colonies grown on LYA medium (0.25% yeast extract) for 10 d. D) Distribution of sporulated cells in colonies grown as in C) determined as described in B). Scale bars in (A) and (C) are 50 μ. Error bars in (B) and (D) represent SEM, n=3.

