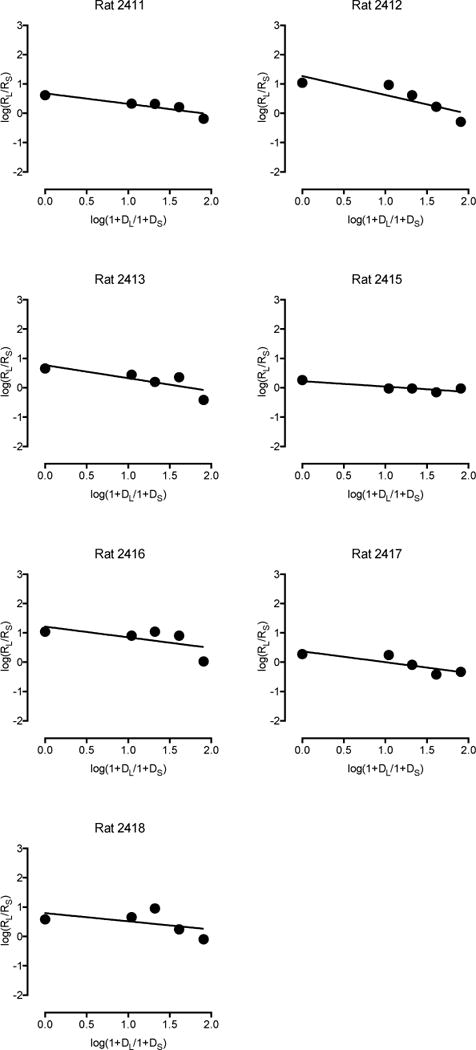
Figure 6.

Sensitivity to reinforcement amount and delay in seven physical activity rats. Log response ratios are plotted as a function of log delay ratios using a linear equation. All plots depict data averaged across the last 12 consecutive days of testing.
