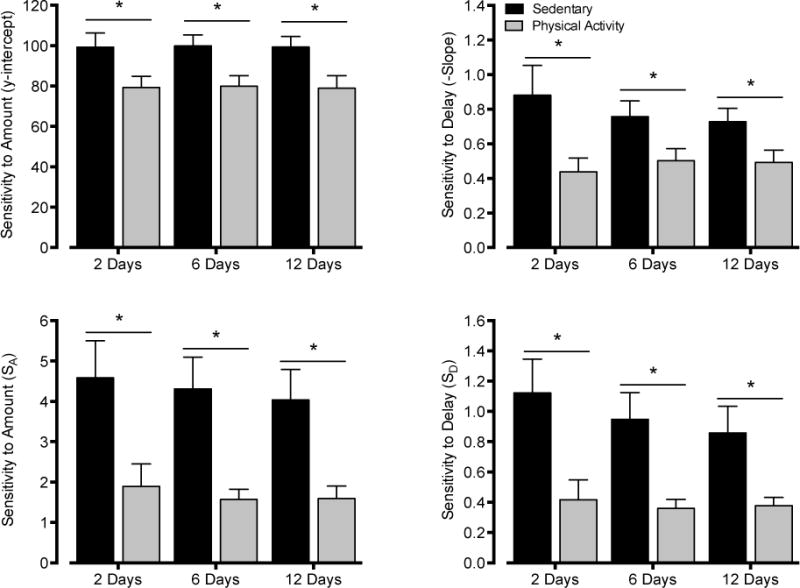
Figure 9.

Sensitivity to reinforcement amount (y-intercept: top left panel; SA: bottom left panel) and sensitivity to reinforcement delay (slope: top right panel; SD: bottom right panel) in sedentary (black bars) and physical activity (gray bars) rats. Data reflect averages from the final two, six, and twelve consecutive days of testing. Asterisks (*) indicate significant differences between groups as determined by independent-samples t-tests.
