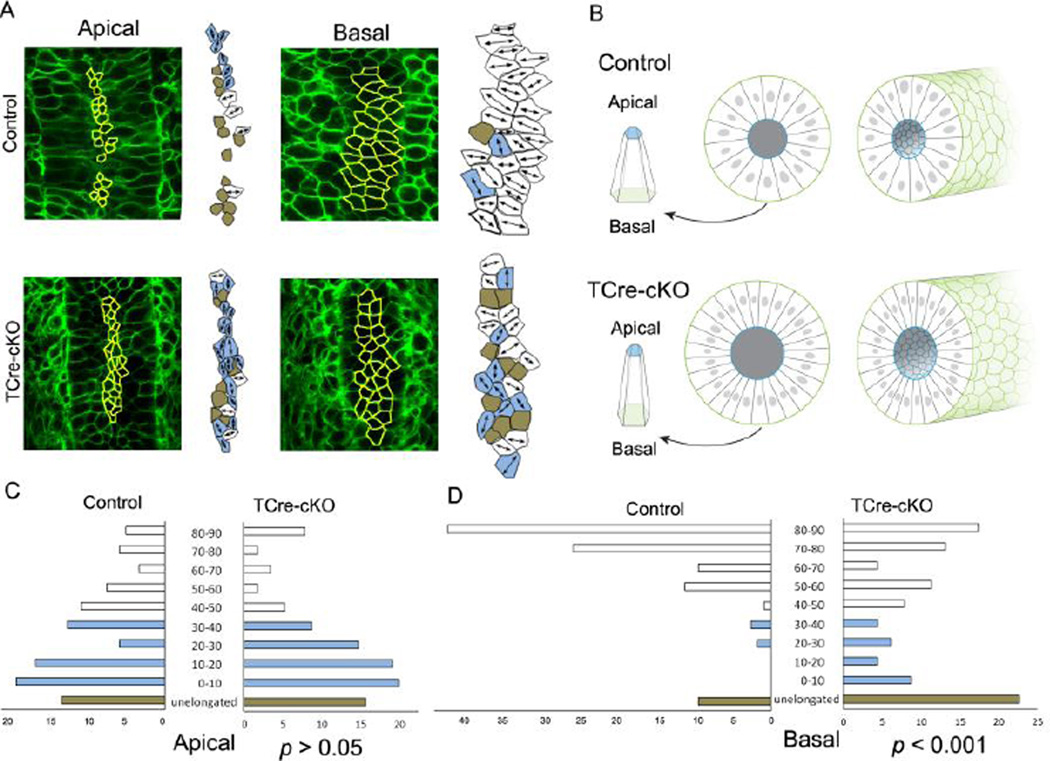
Fig. 7.
Elongation and alignment of epithelial cells in controls and TCre-cKOs. (A) Confocal images and outlines of epithelial cells at apical and basal ends (yellow line) in E18.5 controls and TCre-cKOs, respectively. Mediolaterally elongated cells are marked in white, cells elongated along the duct axis are marked in light blue, and unelongated cells are marked in brown. (B) 3D diagrams of representative epithelial cells, cross-sections and 3D diagrams of Wolffian duct sections of controls and TCre-cKOs, respectively. (C) Quantitation of cellular elongation angle relative to the duct axis at apical ends of epithelial cells in E18.5 controls and TCre-cKOs. There is no significant change in the orientation of the elongated cells at apical ends between controls and TCre-cKOs (p>0.05, KS test). (D) Quantitation of cellular elongation angle relative to the duct axis at basal ends of epithelial cells in E18.5 controls and TCre-cKOs. There is a significant change in the orientation of the elongated cells at basal ends between controls and TCre-cKOs (p<0.001, KS test). White bars show cells that elongate perpendicular to the elongation axis (45–90°). Light blue bars represent cells that elongate parallel (0–45°). Brown bars represent cells that are unelongated. The data were generated from at least 4 different animals. The total number of cells measured is 118 and 114 for controls and TCre-cKOs, respectively.

