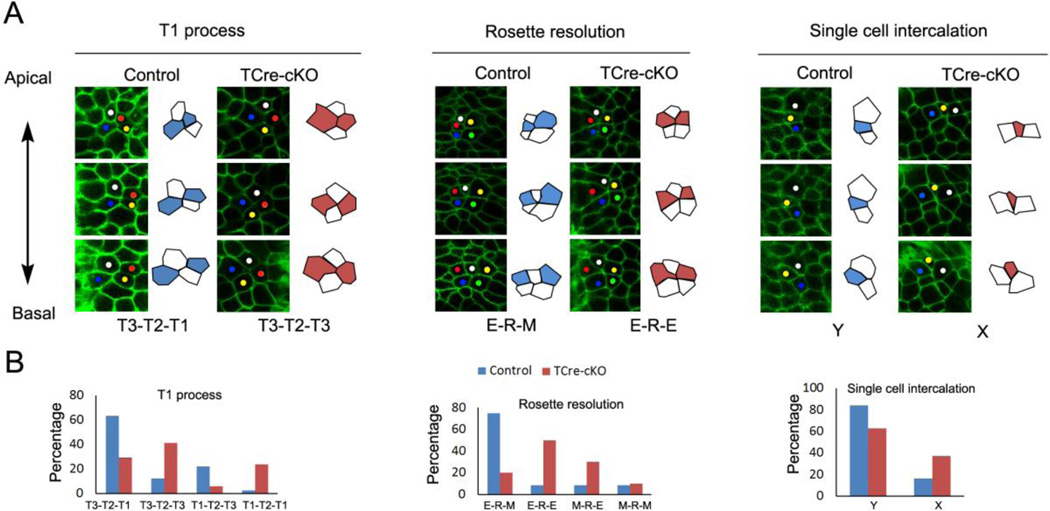
Fig. 8.
Cell rearrangements at mid-levels of epithelial cells. (A) Confocal images and outlines of cell clusters showing the common types of cell rearrangements of T1 process, rosette resolution, and single cell intercalation from the apical to basal direction in controls and TCre-cKOs. The y-axis of the images is parallel to the elongation axis. (B) Frequency of each type of cell rearrangements. The data were generated from at least 4 different animals. The total number of cell clusters analyzed in controls and TCre-cKOs for T1 process is 41, 17, for rosette resolution is 12, 11, for single cell intercalation is 37, 27, respectively.

