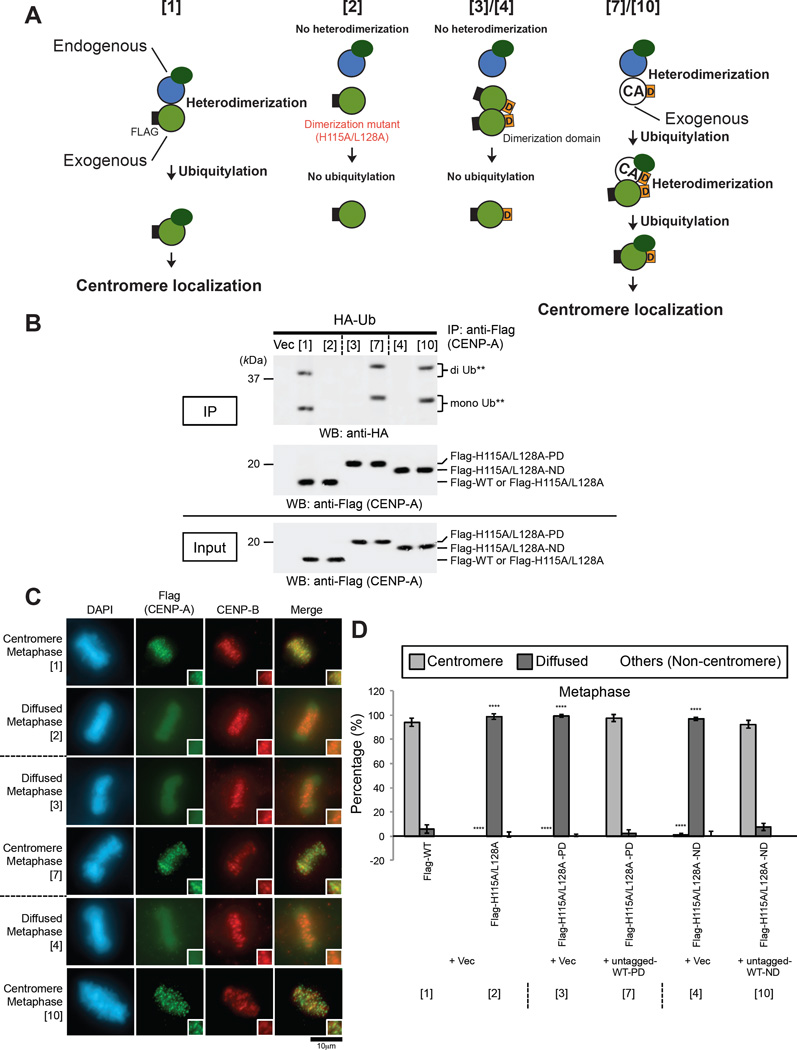
Figure 4. Heterodimarization of New CENP-A with Pre-existing Ubiquitylated CENP-A Is Required for Ubiquitylation of the New CENP-A and Localization of the New CENP-A to the Centromere.
(A) Schematic of the experimental protocol for Figures 4 and S4–S6. Heterodimerization between endogenous CENP-A and Flag-CENP-A WT led to K124 ubiquitylation of Flag-CENP-A WT and localization of Flag-CENP-A WT to the centromere (sample [1]). Single overexpression of Flag-CENP-A H115A/L128A or Flag-CENP-A H115A/L128A-D (“D” refers to the dimerization domain) did not lead to heterodimerization or K124 ubiquitylation of Flag-tagged exogenous CENP-A (sample [2] or [3]/[4]). Overexpression of both Flag-CENP-A H115A/L128A-D and untagged CENP-A WT-D led to heterodimerization and the subsequent K124 ubiquitylation of Flag-tagged exogenous CENP-A (sample [7]/[10]). The N-terminal Flag tag on CENP-A (white “F” in black rectangle) is indicated. See Figure S4A for full set of samples.
(B) In vivo ubiquitylation assay (See CENP-A In Vivo Ubiquitylation Assay in Experimental Procedures). HeLa Tet-Off cells were cotransfected with the indicated constructs as numbered in Figures 4 and S4A, plus CA-UTR #2 siRNA (Table S2). Proteins in 5% of the total cell lysates (Input) and immunoprecipitates (IP) were detected by Western blot analysis using the indicated antibodies. See Figures 4A and S4C for full set of samples.
(C) Immunostaining of HeLa Tet-Off cells cotransfected with the indicated constructs as numbered in Figure 4A and S4C, plus CA-UTR #2 siRNA (Table S2). Representative images of the full set of samples in the same and other cell-cycle stages are shown in Figures S5A, S5C, and S5E. Images of samples [1]-[4], [7], and [10] are the same as those in Figure S5A (see Immunofluorescence in Supplemental Experimental Procedures). DAPI (blue), Flag (green), and endogenous CENP-B (red), which served as a centromere localization control during metaphase, were visualized. Scale bar, 10 µm.
(D) Histograms summarizing the localization patterns shown in (C). More than 50 metaphase cells were counted per experiment (n ≥ 3 experiments), and the mean percentages (±SD) are shown. “Others (Non-centromere)” indicates mostly cells that were damaged or died presumably because of transfection or other treatments. ****P < 0.0001 compared with the sample [1] (Student’s t test). See also Figures S5B, S5D, and S5F for full set of samples in the same and other cell-cycle stages; results for samples [1]-[4], [7], and [10] are the same as those in Figure S5B.

