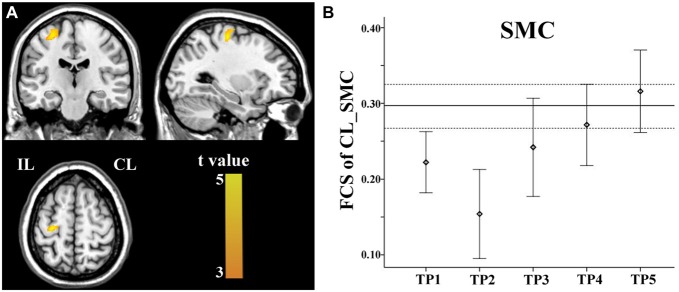
Figure 5.
Linear increase in FCS between the contralesional SMC and the ipsilesional SMC. The ipsilesional SMC (A) exhibit linear increases in FCS with the contralesional SMC. The solid and dashed lines (B) demonstrate the mean and standard error of the FCS in normal controls, respectively. Error bars illustrate the standard error. CL, contralesional; FCS, functional connectivity strength; IL, ipsilesional; SMC, sensorimotor cortex; TP, time points.

