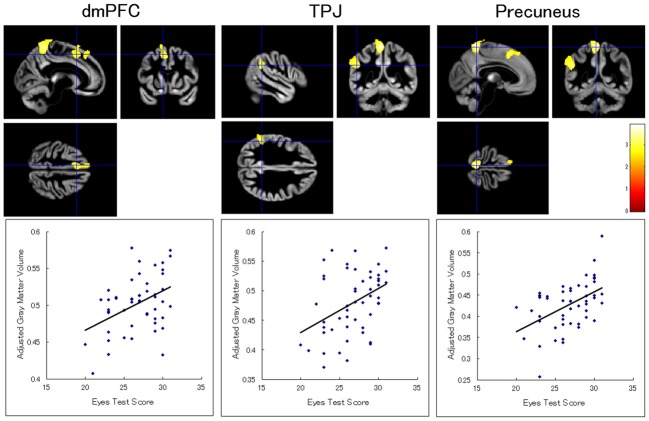
Figure 1.
Brain regions showing a significant positive association between Eyes Test score and gray matter volume. (Top) Statistical parametric maps showing significant associations with the Eyes Test scores in the dorsomedial prefrontal cortex (dmPFC), temporoparietal junction (TPJ), and precuneus in the left hemisphere. The height threshold is set at an uncorrected p < 0.01. The areas are overlaid on the anatomical magnetic resonance images of the mean gray matter of participants involved in the study. The blue crosses indicate the locations of the peak voxels. The red–yellow color scale represents the T-value. (Bottom) Scatterplots of the adjusted gray matter volumes as a function of the Eyes Test scores at the peak voxels.

