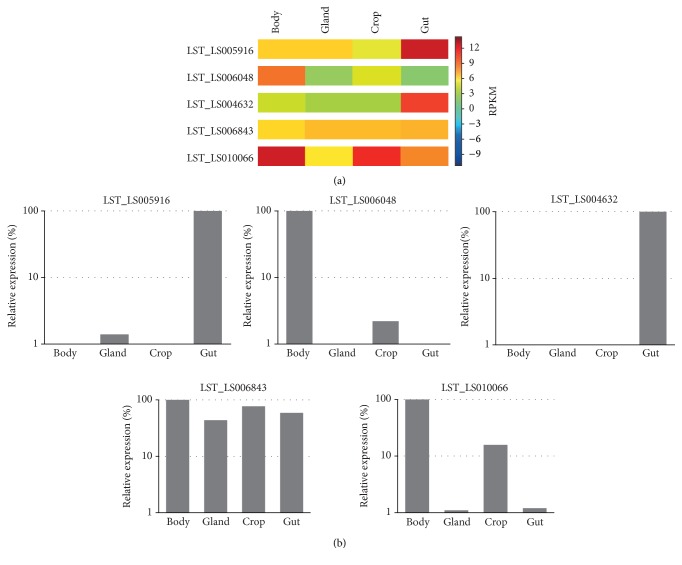
Figure 6.
Verification of digital gene expression analysis by quantitative RT-PCR. (a) The individual clusters encoding for aspartic (LST_LS005916), cysteine (LST_LS006048), metallo (LST_LS004632), threonine (LST_LS006843), and serine (LST_LS010066) peptidases are depicted on the left. Shown are log2-transformed RPKM values (blue resembles lower-expressed genes, while red represents highly expressed genes). (b) The mRNA expression profiles of five enzymatic genes in various larval tissues were determined by qRT-PCR and normalized with the 60S acidic ribosomal protein P0 (RPLPO) and 40S ribosomal protein S3 (RPS3) genes. The expressions of individual genes were related to the maximum mRNA level of each gene set as 100%.

